Open Source Β· AGPL-3.0

Rackscope

Prometheus-first physical infrastructure monitoring

When an alert fires, monitoring tools indicate what is wrong β€” but rarely where the problem is located in the physical infrastructure. Rackscope provides that physical context, mapping every metric to its exact location: site, datacenter, room, aisle, rack, device, instance.

πŸ””Toulouse HPC
β†’
Machine Room A
β†’
Compute Aisle
β†’
Rack C04
β†’
compute-042
https://rackscope.dev/home
1 / 6
Rackscope β€” Analytics Dashboard
Analytics Dashboard
Drag-and-drop widget grid with live health, alerts, world map and Prometheus stats
Design Philosophy

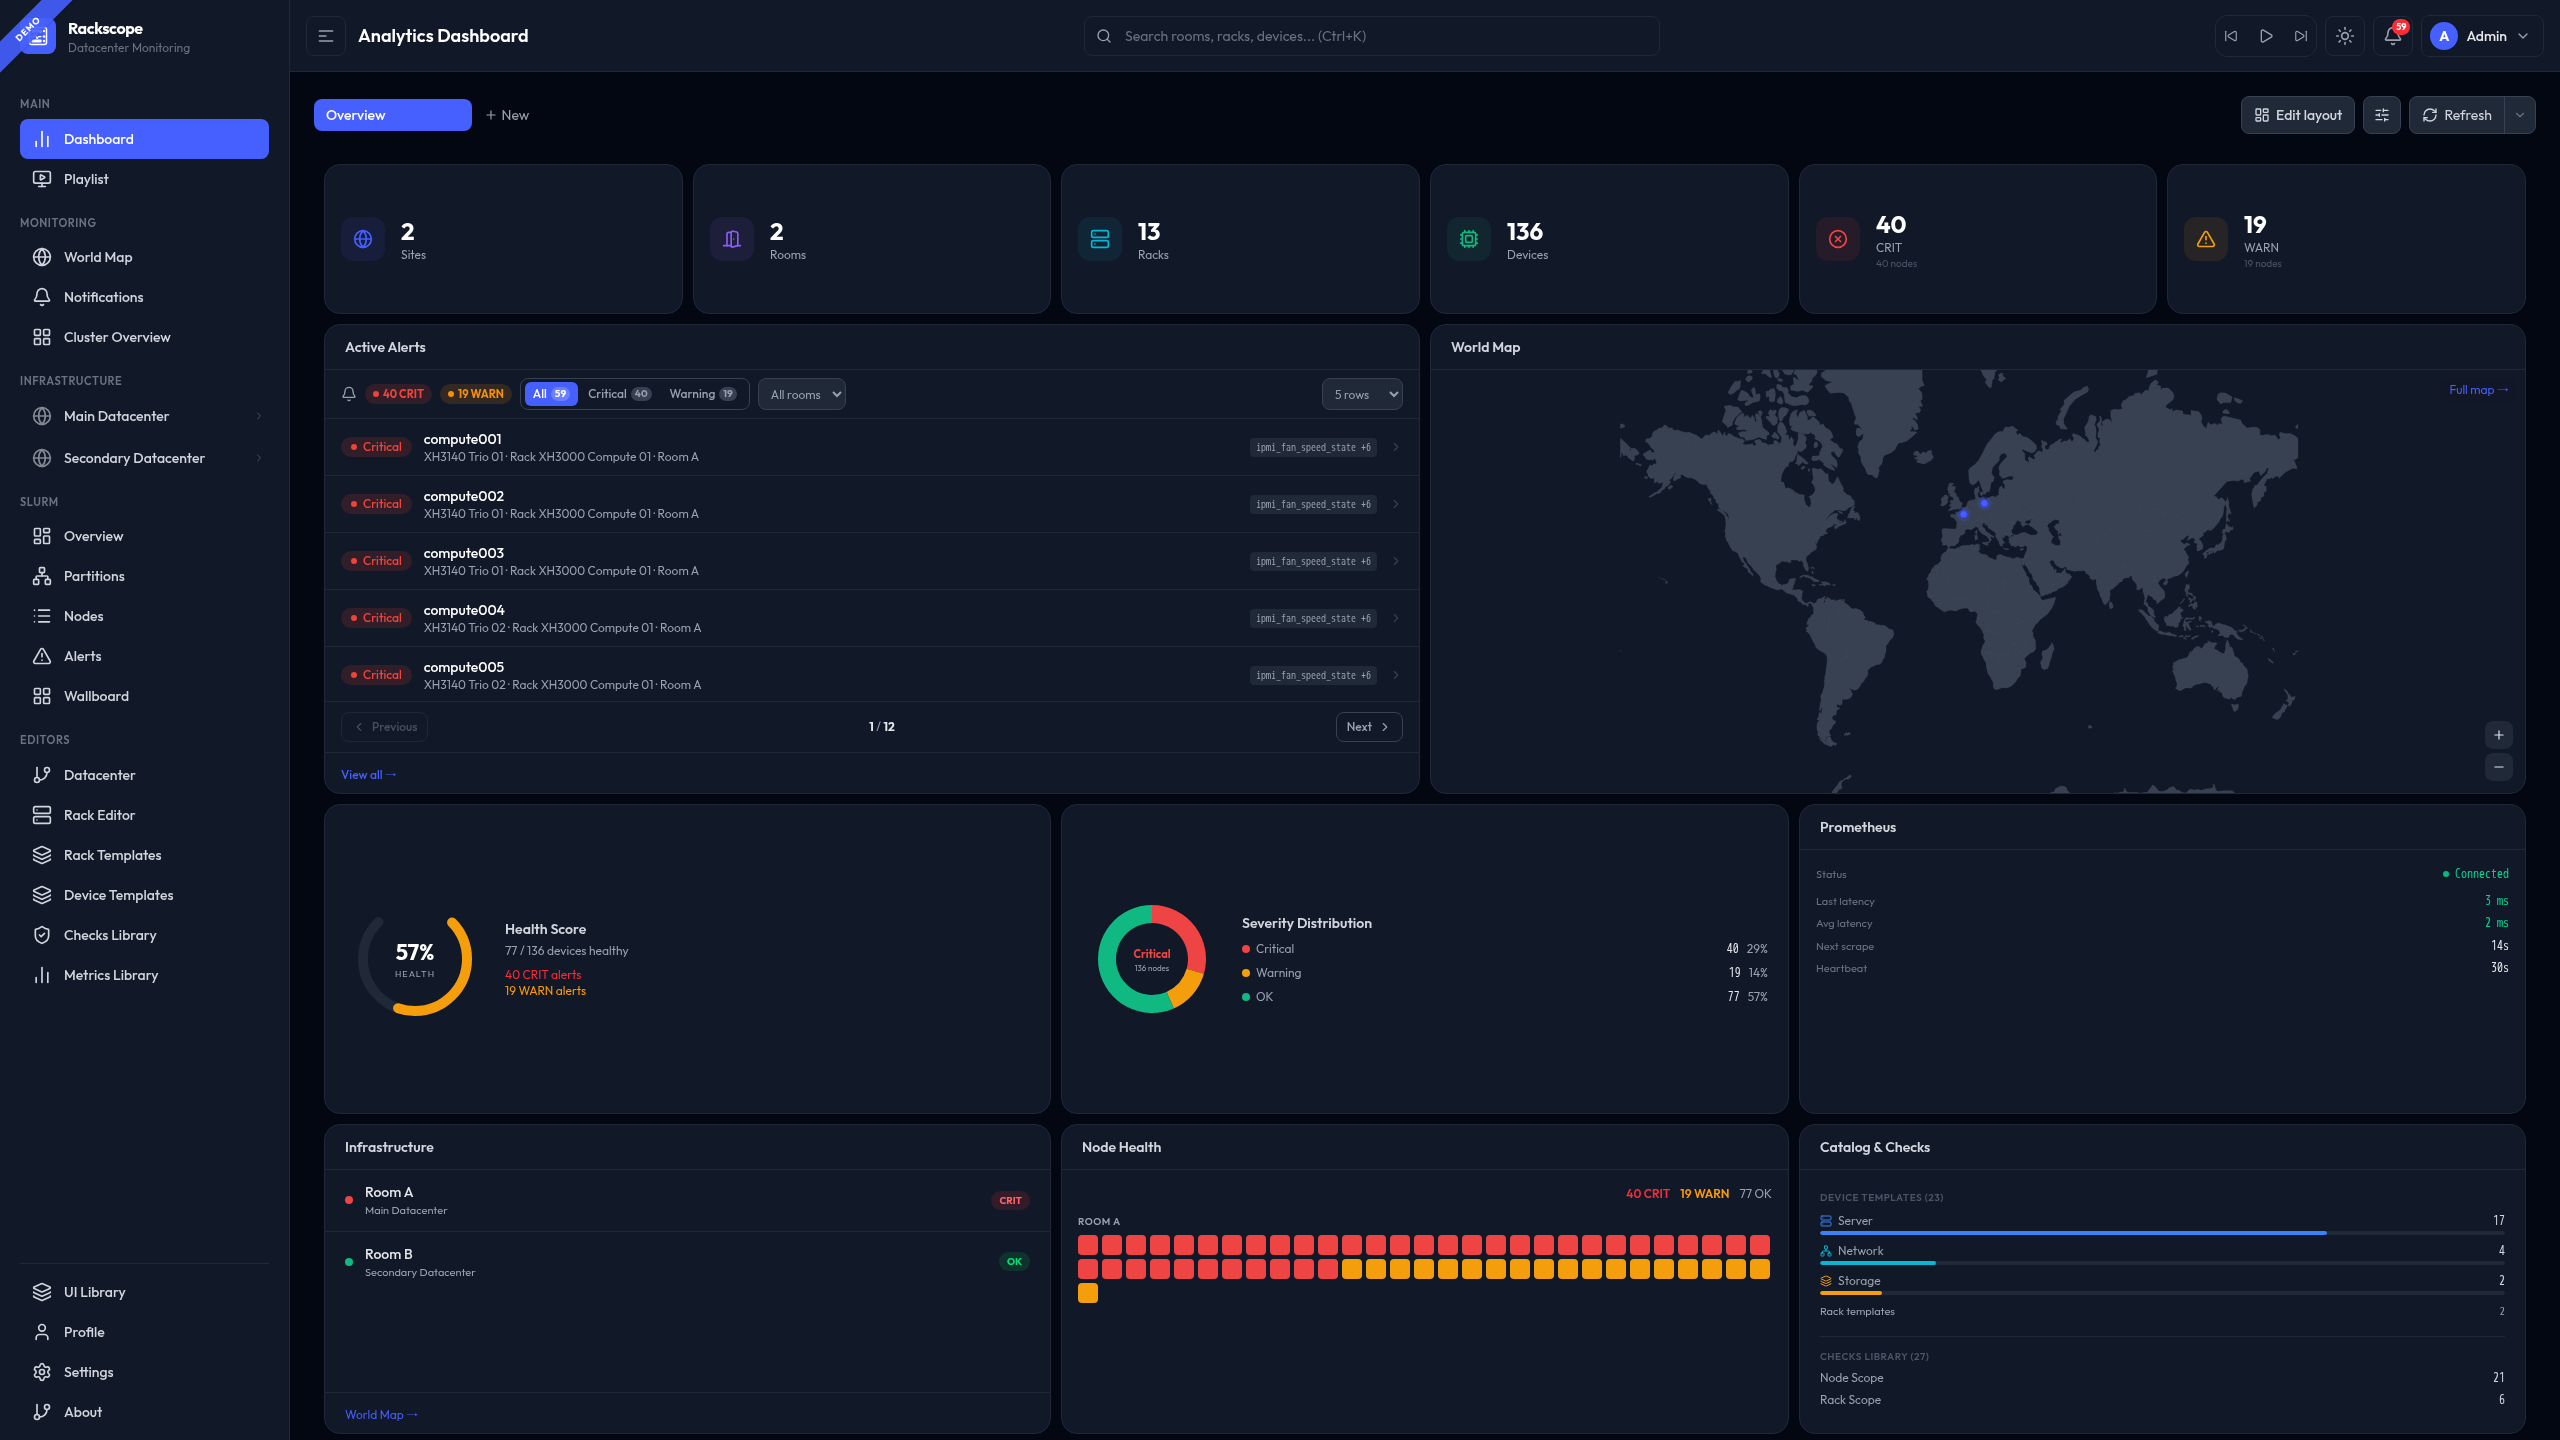
See your infrastructure,
not your spreadsheets.

Three principles that are non-negotiable.

πŸ“„

Zero Database

All configuration is stored in YAML files β€” GitOps-compatible, version-controlled, and diff-friendly. Commit your infrastructure topology to Git and roll back with a single command.

πŸ“‘

Prometheus-Only

Every health state derives from a live PromQL query against your existing Prometheus instance. No agents, no collectors, no additional telemetry infrastructure to operate.

πŸ—οΈ

Physical Hierarchy

Site β†’ Room β†’ Aisle β†’ Rack β†’ Device β†’ Instance. Health states propagate upward β€” a failing node elevates its rack to CRIT, which propagates to the room level.

Physical drill-down

Zoom in. All the way.

Every alert is anchored to a precise physical location. Navigate progressively from a global overview to the exact device β€” at each level, only the relevant information is displayed.

🌍
GlobalAll sites β€” health summary, world map, active alerts
start here
🏒
DatacenterSite-level overview β€” rooms, live status, drill-down
πŸ—ΊοΈ
RoomFloor plan β€” aisle layout, rack grid, health heatmap
πŸ”²
AisleRow of racks β€” aisle state, cooling zones
πŸ–₯️
RackFront/rear elevation β€” device placement, U occupancy
⚑
DeviceChassis or unit β€” instances, checks, live metrics
πŸ”¬
InstanceSingle node β€” health state, check results
Universal by design

Any metric. Any team.

Any metric exposed in Prometheus can become a visible health check in Rackscope β€” whether it originates from hardware, software, network infrastructure, or HPC workloads.

πŸ”©
Hardware teams
Physical infrastructure
Server / rack health
Temperature & cooling
PDU load & power
Network infrastructure
Storage health
Cooling sensors
Prom
QL
πŸ’»
Software teams
Services & applications
Service availability
Application error rates
HPC workload states
Job queue depth
Any custom exporter
Plugin system
⚑
CMDB-agnostic. Generate your YAML topology from NetBox, RacksDB, any script, or use the API directly. No vendor lock-in β€” if your tools can write a file, Rackscope can read it.
Positioning

The physical layer that was missing.

Rackscope does not replace existing tools. It fills the gap between metrics dashboards and supervision platforms β€” adding the physical location of every alert to the monitoring chain.

πŸ“Š
Grafana
Metrics & dashboards. Charts, panels, time series. Indicates what is happening.
"cpu_usage is 95%"
β†’
RACKSCOPE
πŸ”­
Physical context
Bridges metrics to physical location. Answers where β€” which rack, which aisle, which room.
"Rack C04, Aisle 2, Machine Room A"
β†’
🚨
Supervision
Full monitoring & alerting. Nagios, Zabbix, PagerDuty. Determines what action to take.
"Ticket #4821 opened"

Not a replacement. The intermediate layer that was missing between your metrics dashboards and your supervision platform.

How it works

From Prometheus to physical view

Four steps β€” from your existing infrastructure to a live physical view. No agent to deploy, no database to provision.

01
πŸ“„

Define your topology

Write YAML files describing your physical infrastructure β€” sites, rooms, aisles, racks, devices. Or generate them from NetBox, RacksDB, any script, or the API.

topology.yaml
β†’
02
πŸ“‘

Connect Prometheus

One URL. Point Rackscope at your existing Prometheus instance. No collector to deploy, no agent to install, nothing to change in your stack.

prometheus_url:
β†’
03
πŸ”—

Map your checks

Any metric with the right labels becomes a visible health check. IPMI temperature, PDU load, software service status, Slurm node state β€” anything Prometheus scrapes.

expr: up{...}
β†’
04
πŸ”­

See your infrastructure

Launch and navigate from global to instance level. When something is CRIT, you know exactly which rack, which aisle, which room β€” not just a hostname in an alert.

make up

The documentation covers everything in detail. Start where it makes sense for you.

Rackscope Β· AGPL-3.0Not another Grafana plugin.