User Guide Overview
Rackscope provides a set of physical views and management tools for monitoring data center and HPC infrastructure through Prometheus metrics.
The drill-down approach
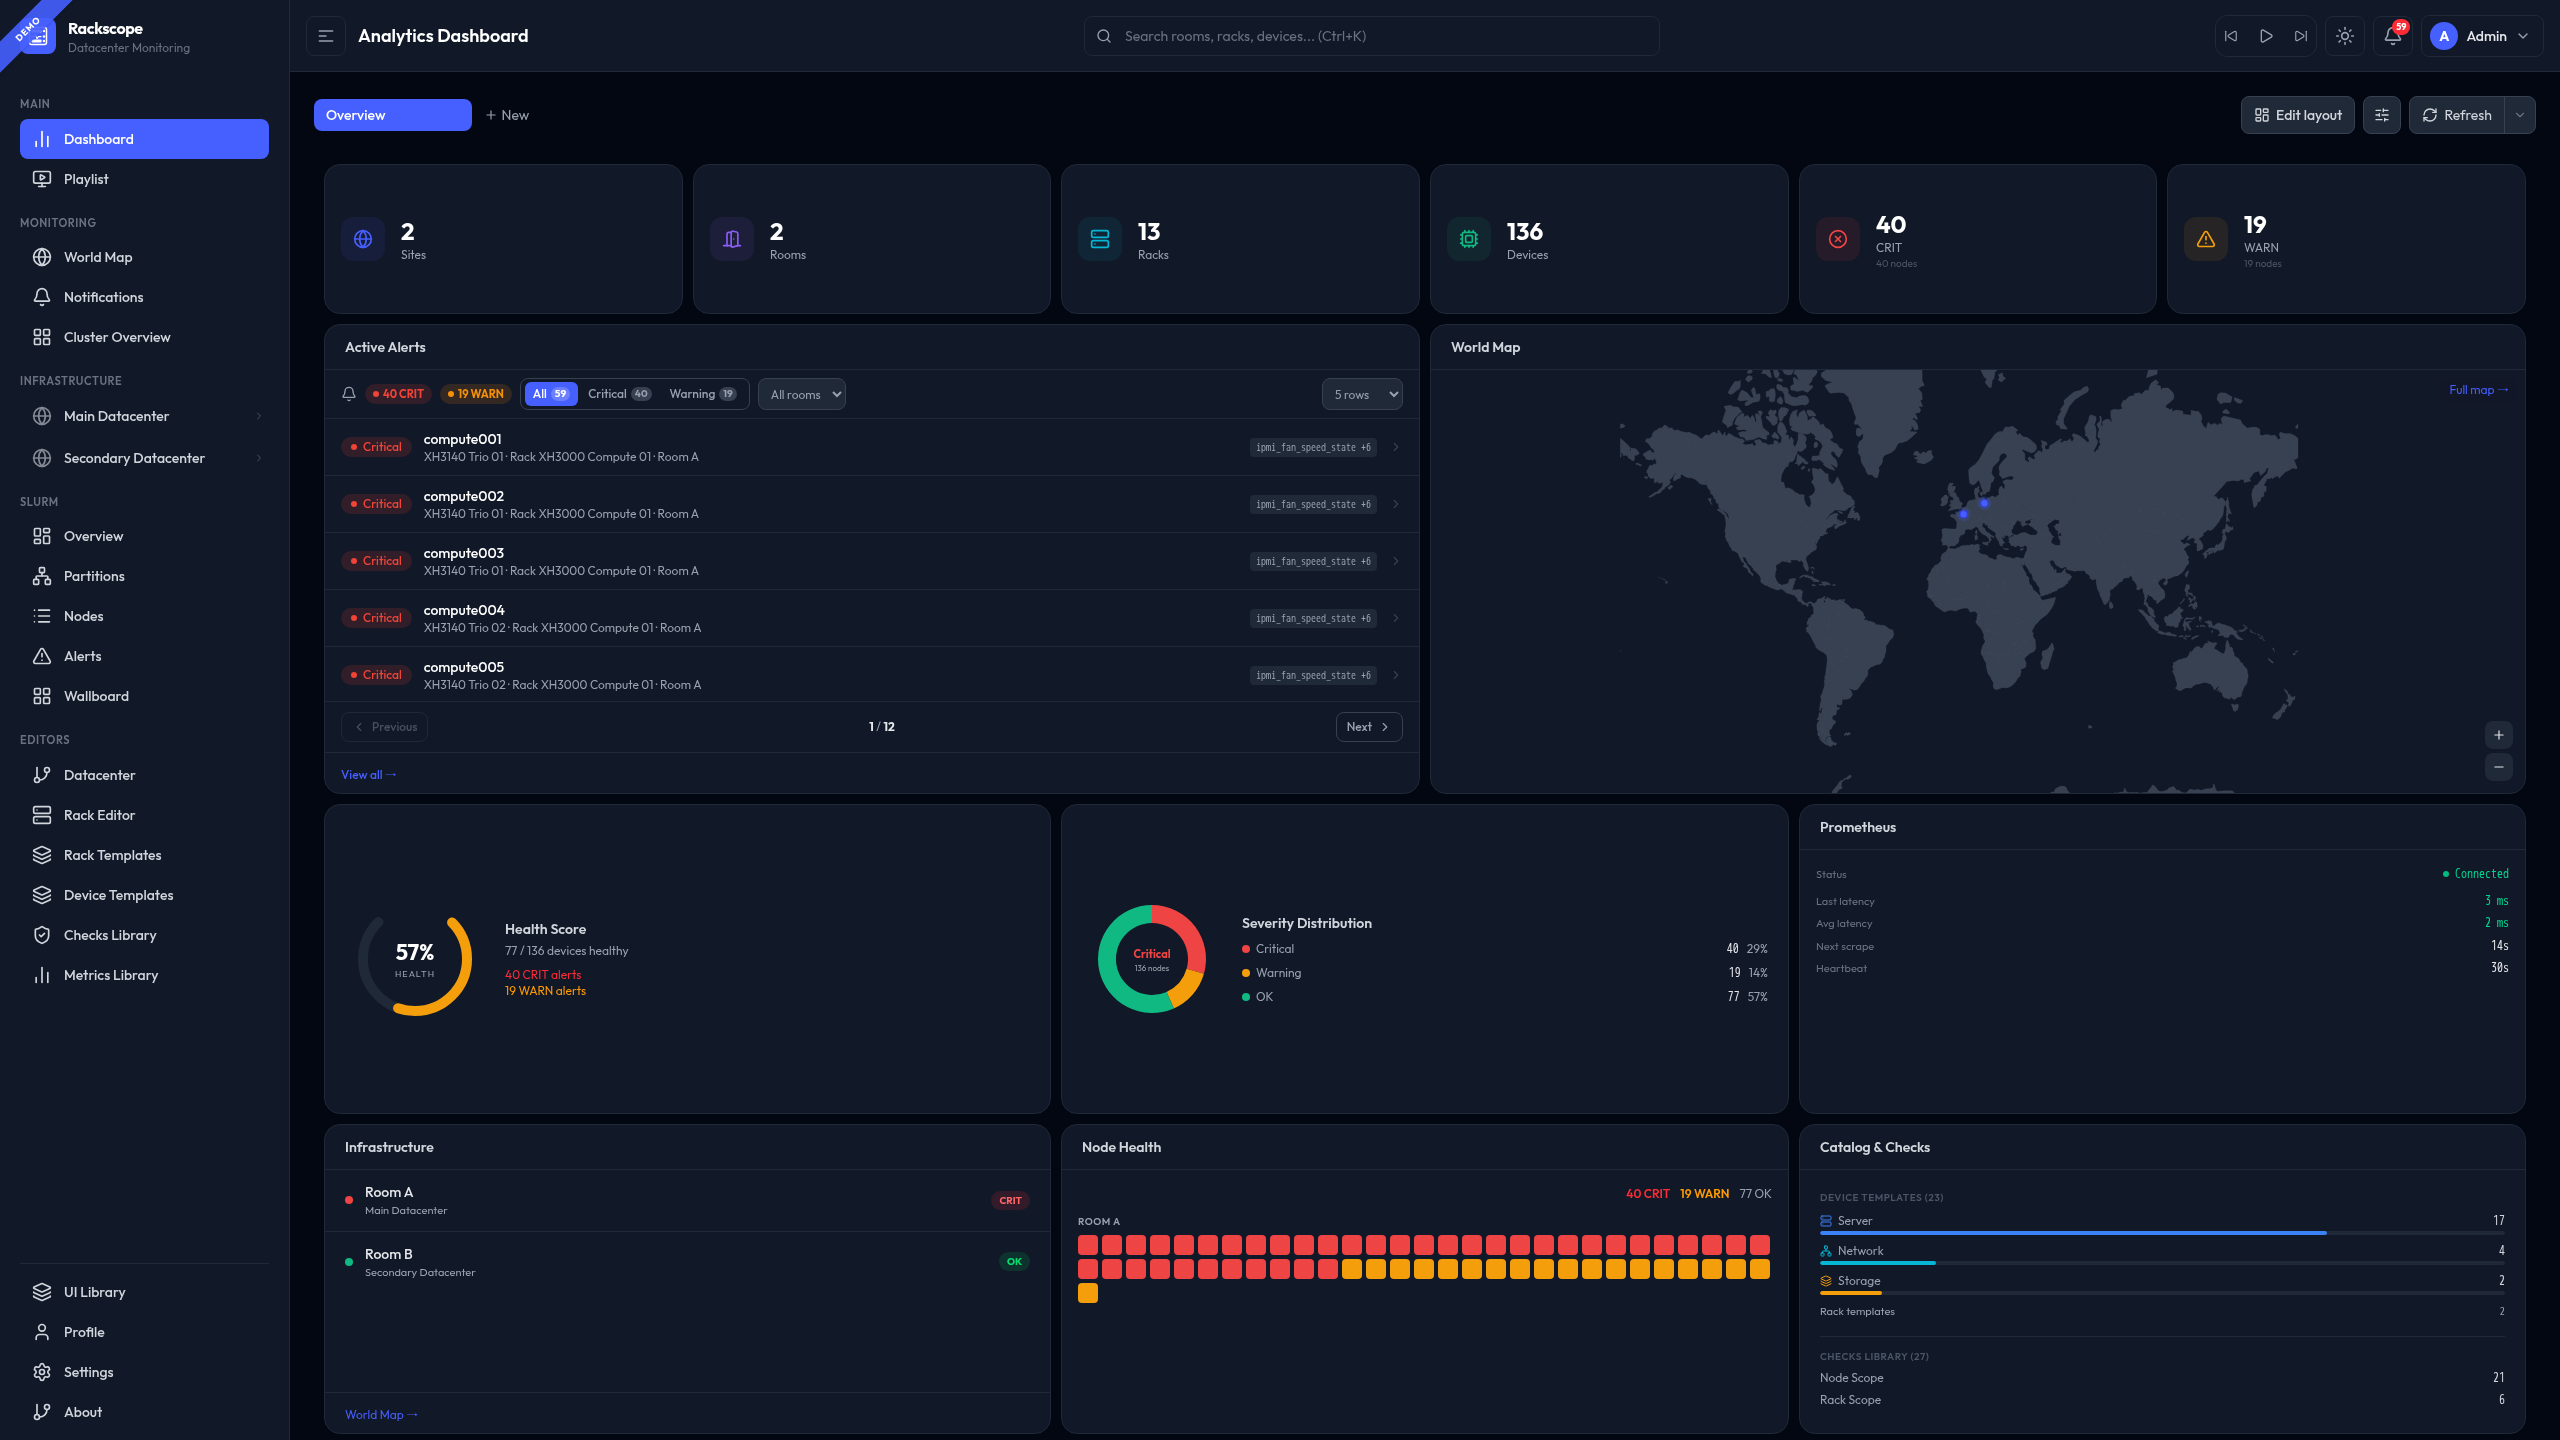
Rackscope is organized around a progressive drill-down model. The operator starts from a global overview — all sites, active alerts, aggregate health — and navigates progressively toward finer levels of detail: datacenter, room, aisle, rack, device, and finally the individual instance.
At each level, health states aggregate upward from child entities. A single failing node elevates its rack to CRIT, which propagates to the room level. This makes it immediately apparent where in the physical infrastructure an issue is located, without having to cross-reference multiple tools.
Navigation
The sidebar provides access to all views, organized by domain:
- Infrastructure: World map, room views, rack views, device views
- Workload (Slurm plugin): Overview, Nodes, Partitions, Alerts, Wallboard
- Editors: Topology, Rack, Templates, Checks, Settings
- Simulator (demo plugin): Scenario control, overrides
Core Concepts
Health States
Every entity in the topology has a health state:
| State | Meaning |
|---|---|
| OK | All checks passing |
| WARN | At least one warning |
| CRIT | At least one critical issue |
| UNKNOWN | No data or check error |
States aggregate upward: Node → Chassis → Rack → Room → Site. The worst state wins.
Physical Hierarchy
Site
└── Room
    └── Aisle
        └── Rack
            └── Device
                └── Instance (Prometheus node)
Each level shows the aggregated health of everything below it.
Views Overview
| View | URL | Purpose |
|---|---|---|
| World Map | /views/worldmap | Site overview with geolocation |
| Room | /views/room/:id | Floor plan with rack grid |
| Rack | /views/rack/:id | Front/rear rack views |
| Device | /views/device/:rackId/:deviceId | Instance-level detail |
| Datacenter | /views/site/:siteId | Site-level overview with room cards and mini rack grids |
| Cluster | /views/cluster | Cluster overview |