Visual Editors
Rackscope provides visual editors for all configuration. Changes are saved via the API and take effect immediately (no restart required for most changes).
Topology Editor
URL: /editors/topology
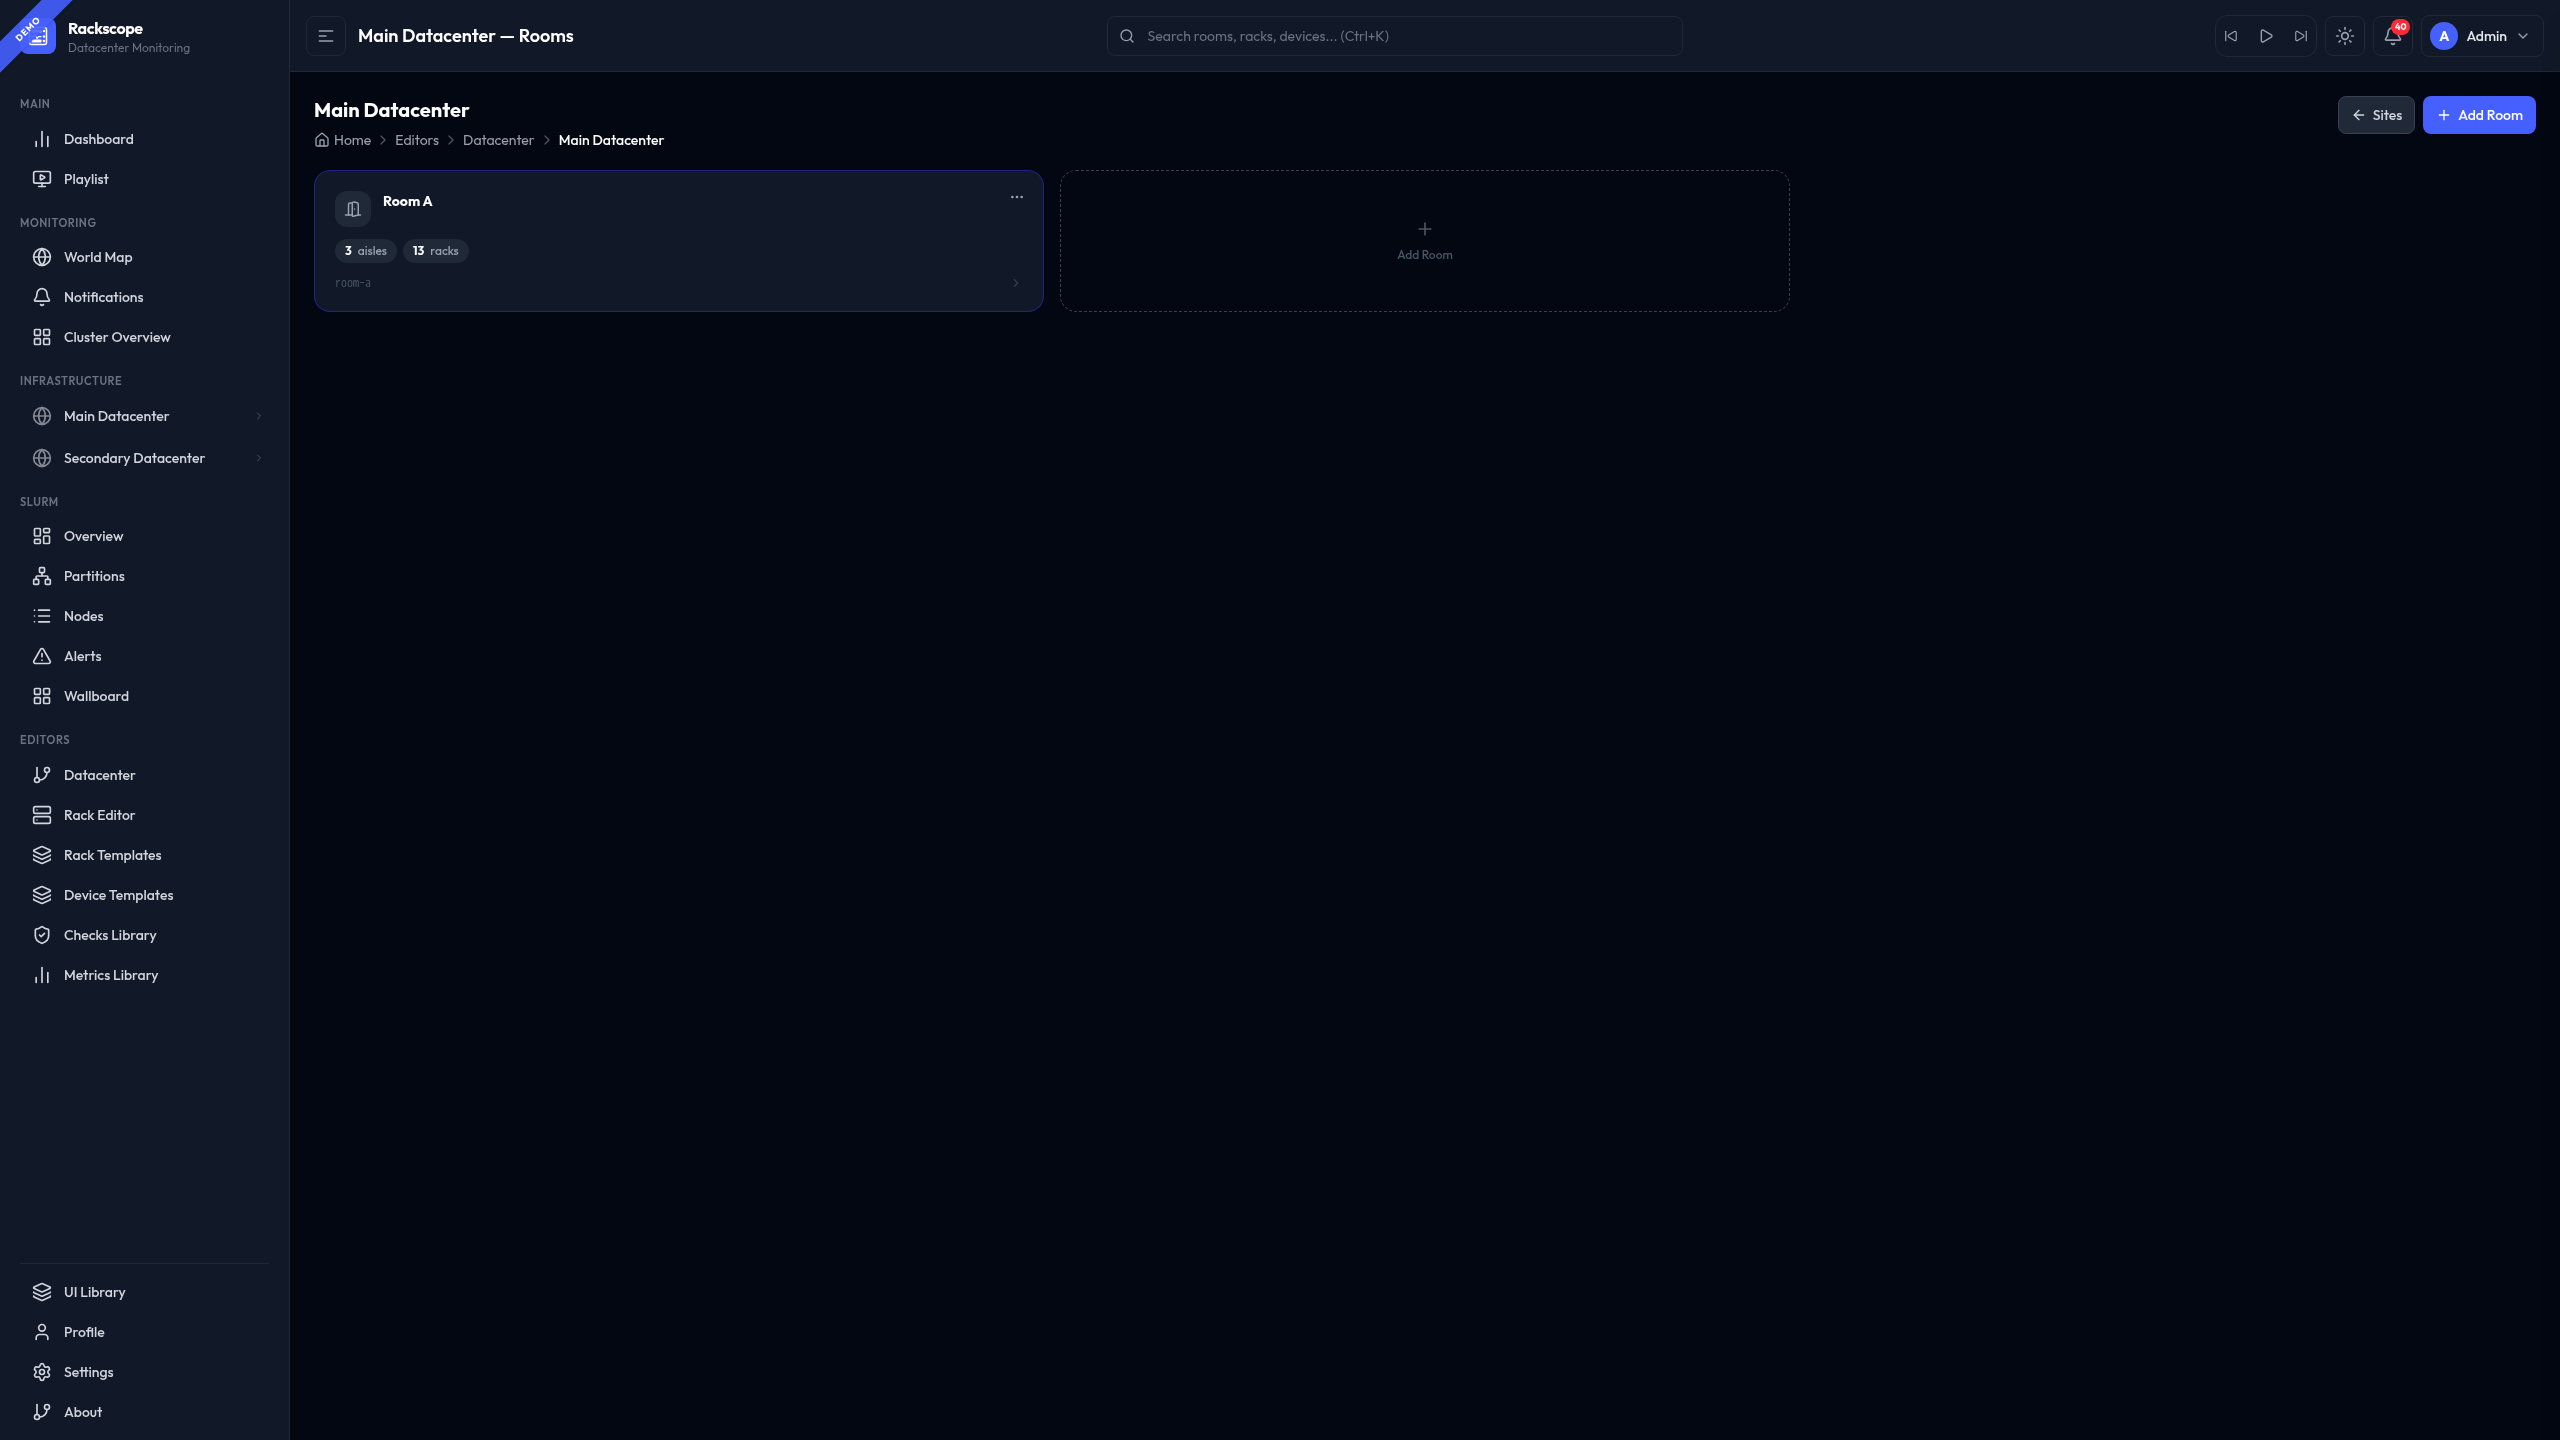
Edit the physical infrastructure hierarchy:
- Add/edit/delete sites, rooms, aisles, racks, devices
- Drag-and-drop rack placement
- Device U-position validation (collision detection)
Rack Editor
URL: /editors/rack
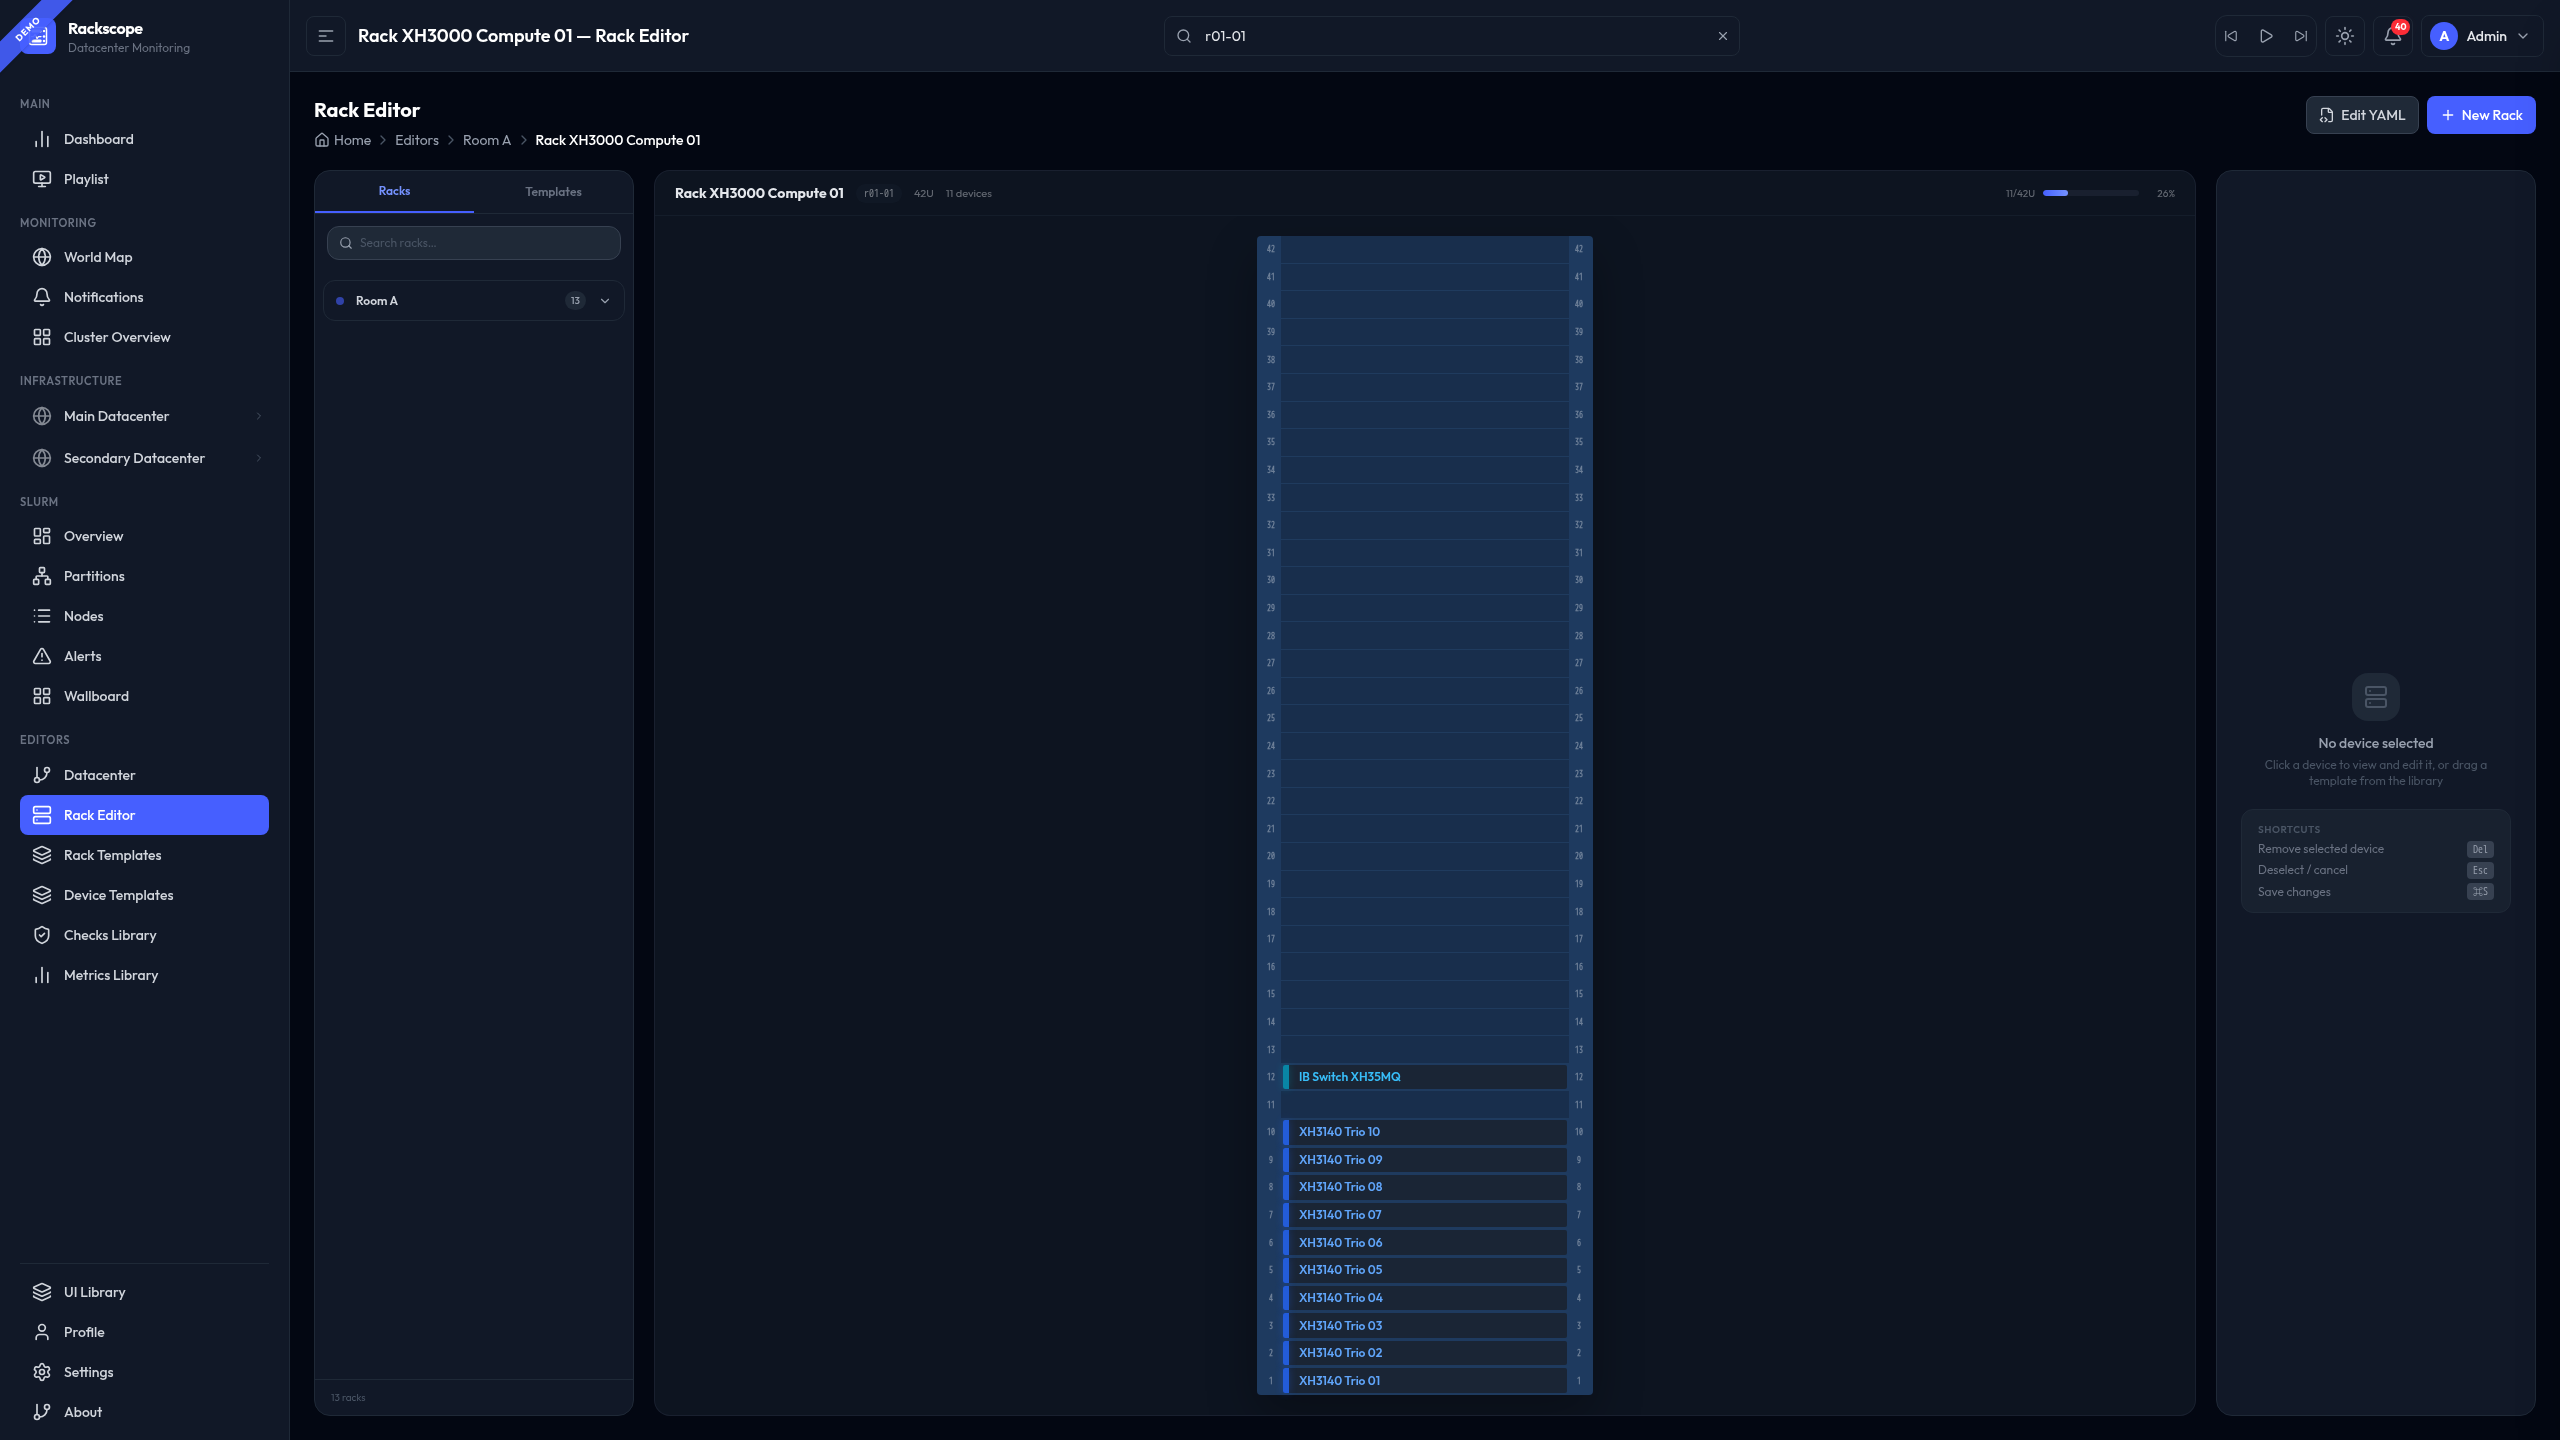
Edit rack layouts:
- Add/move/remove devices
- Configure U positions
- Set device templates
- Preview front/rear views
Templates Editor
URL: /editors/templates
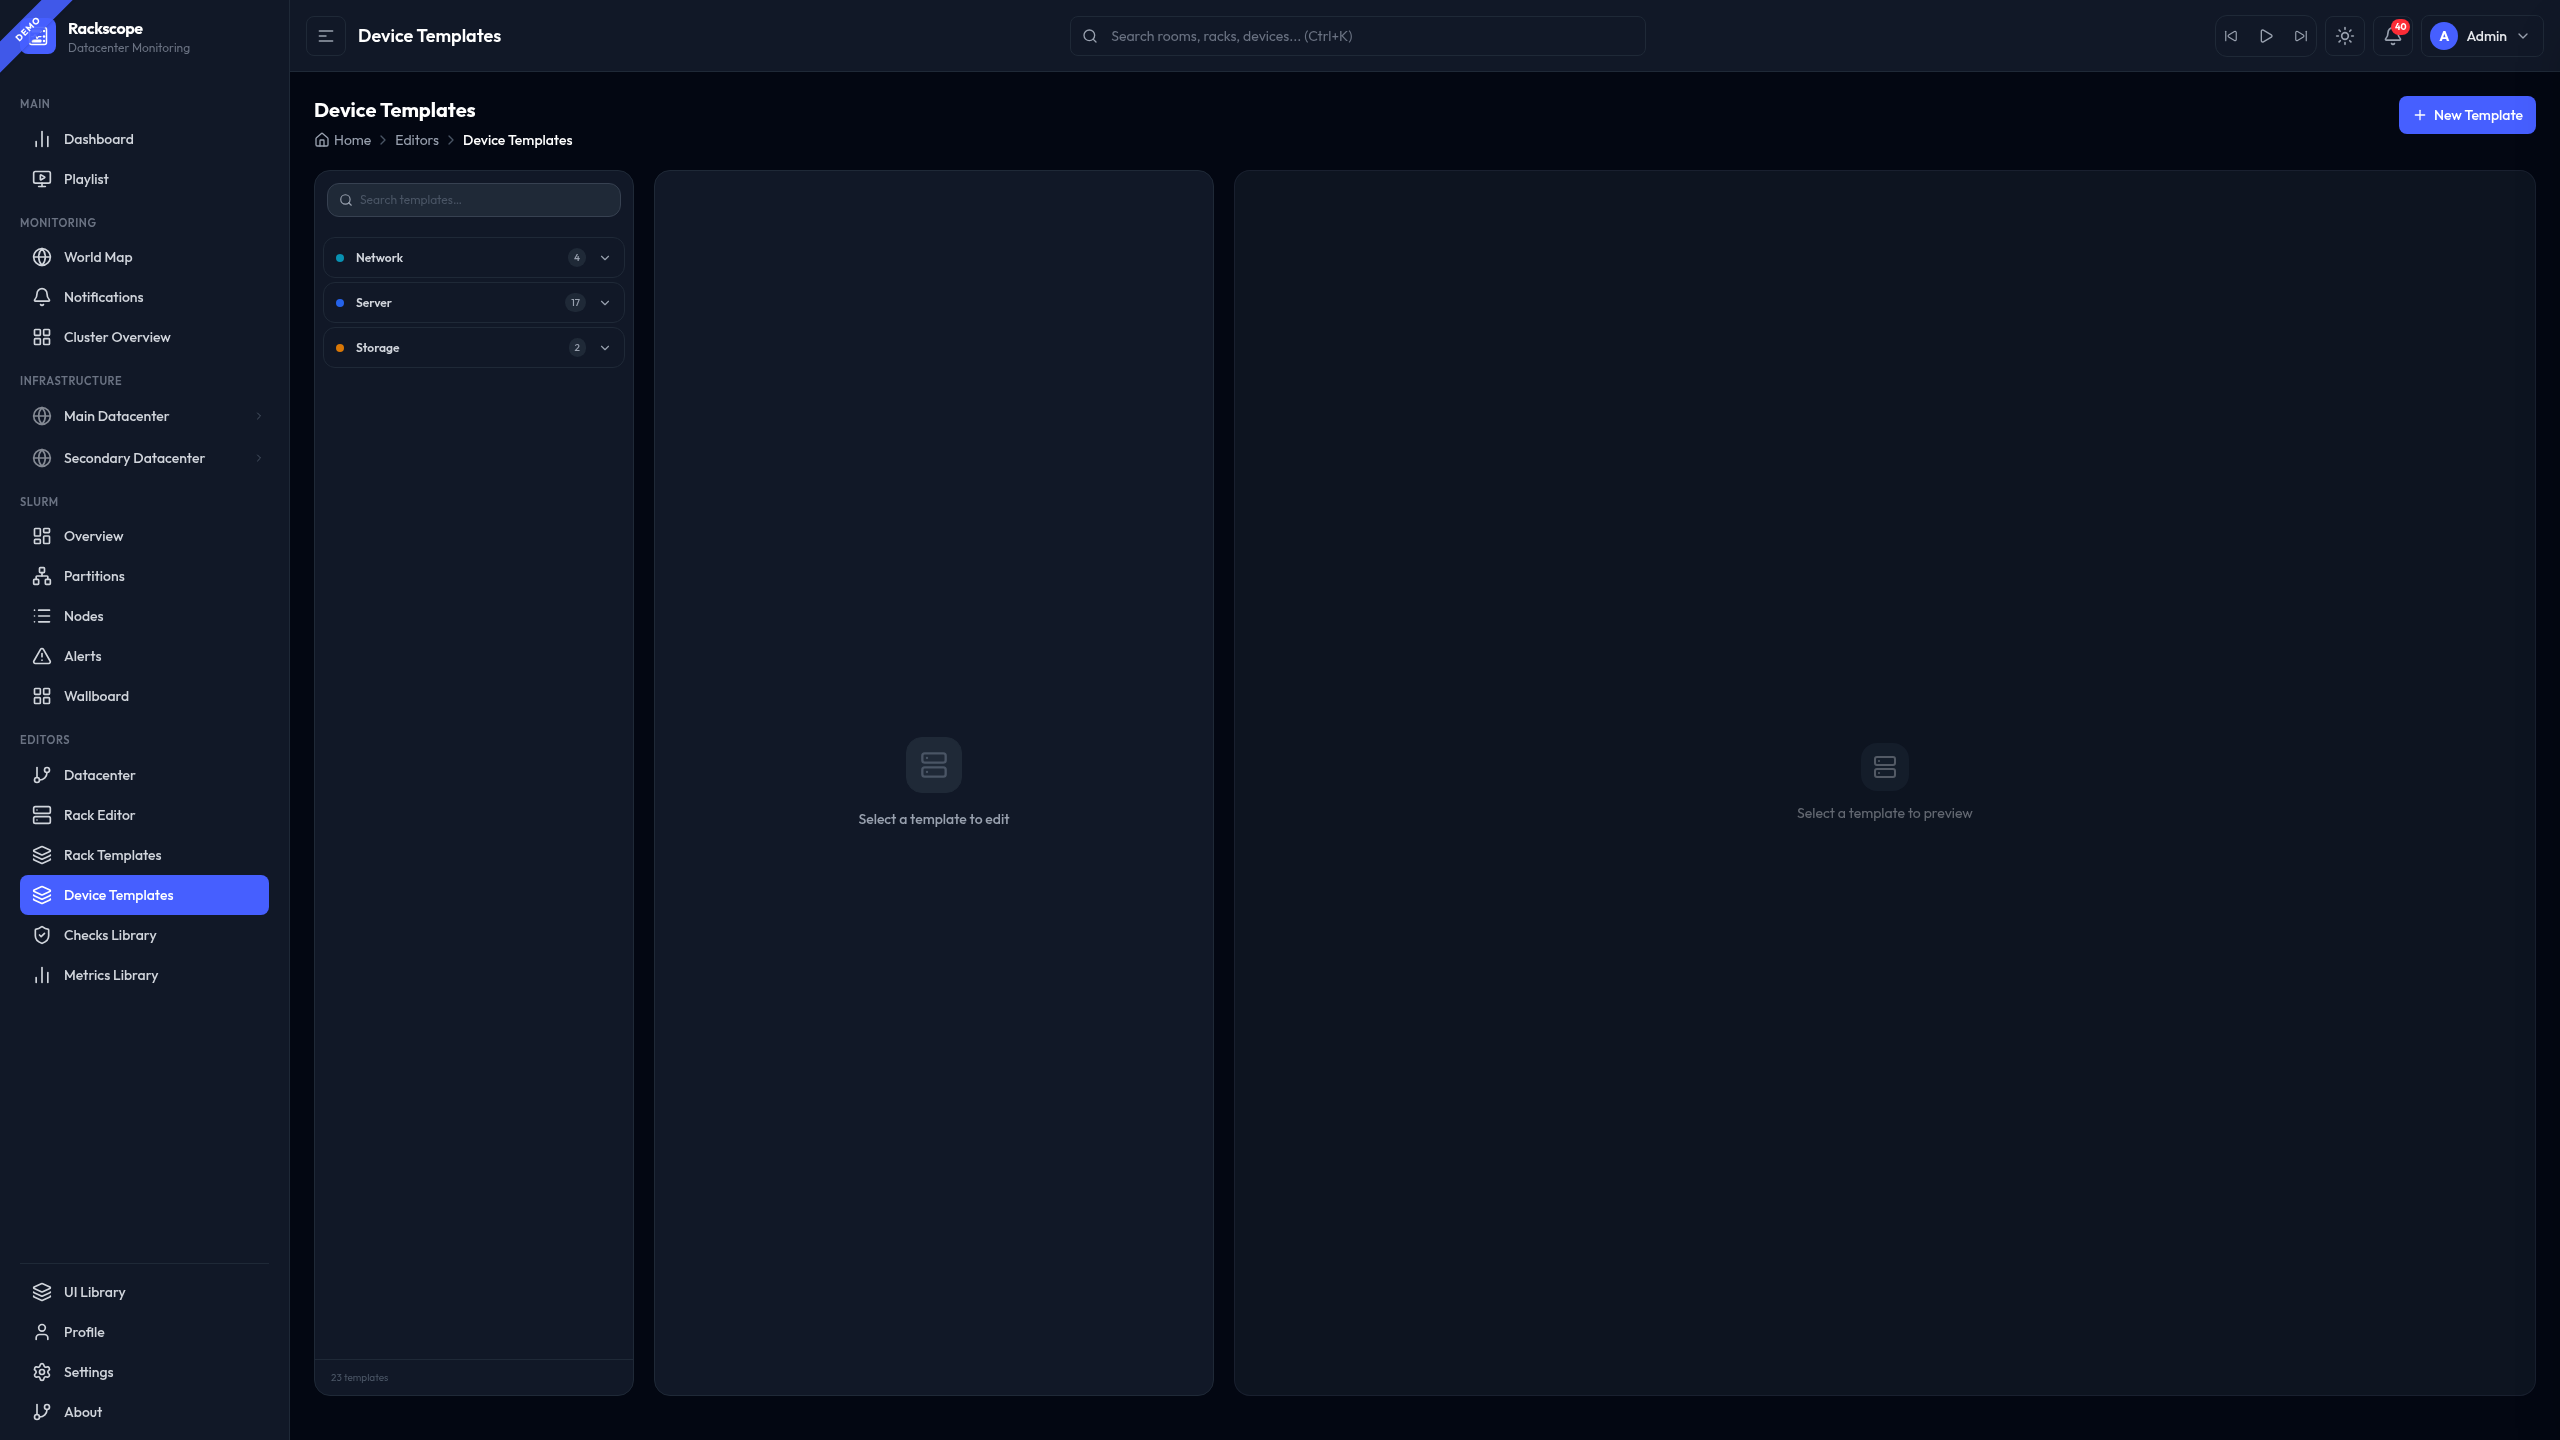
Edit device and rack templates:
- Device dimensions, layout, checks, metrics
- Rack component definitions
- View YAML source with Monaco editor
Rack Template Editor
URL: /editors/rack-templates
Edit rack templates — the pre-built infrastructure definitions attached to racks (PDUs, HMC modules, rear components):
- Create and edit
RackTemplatedefinitions with rear and side-mounted components - Set rack component types (
pdu,switch,hmc,rmc,cooling) and their u_height - Assign checks and metrics to rack-level components
- View YAML source with Monaco editor
Rack templates are referenced from topology YAML via template_id:
# In a rack definition
template_id: apc-standard-42u
Once a rack template is assigned, its infrastructure (power banks, cable management, HMC) appears automatically in the rear view of the Rack View.
Checks Editor
URL: /editors/checks
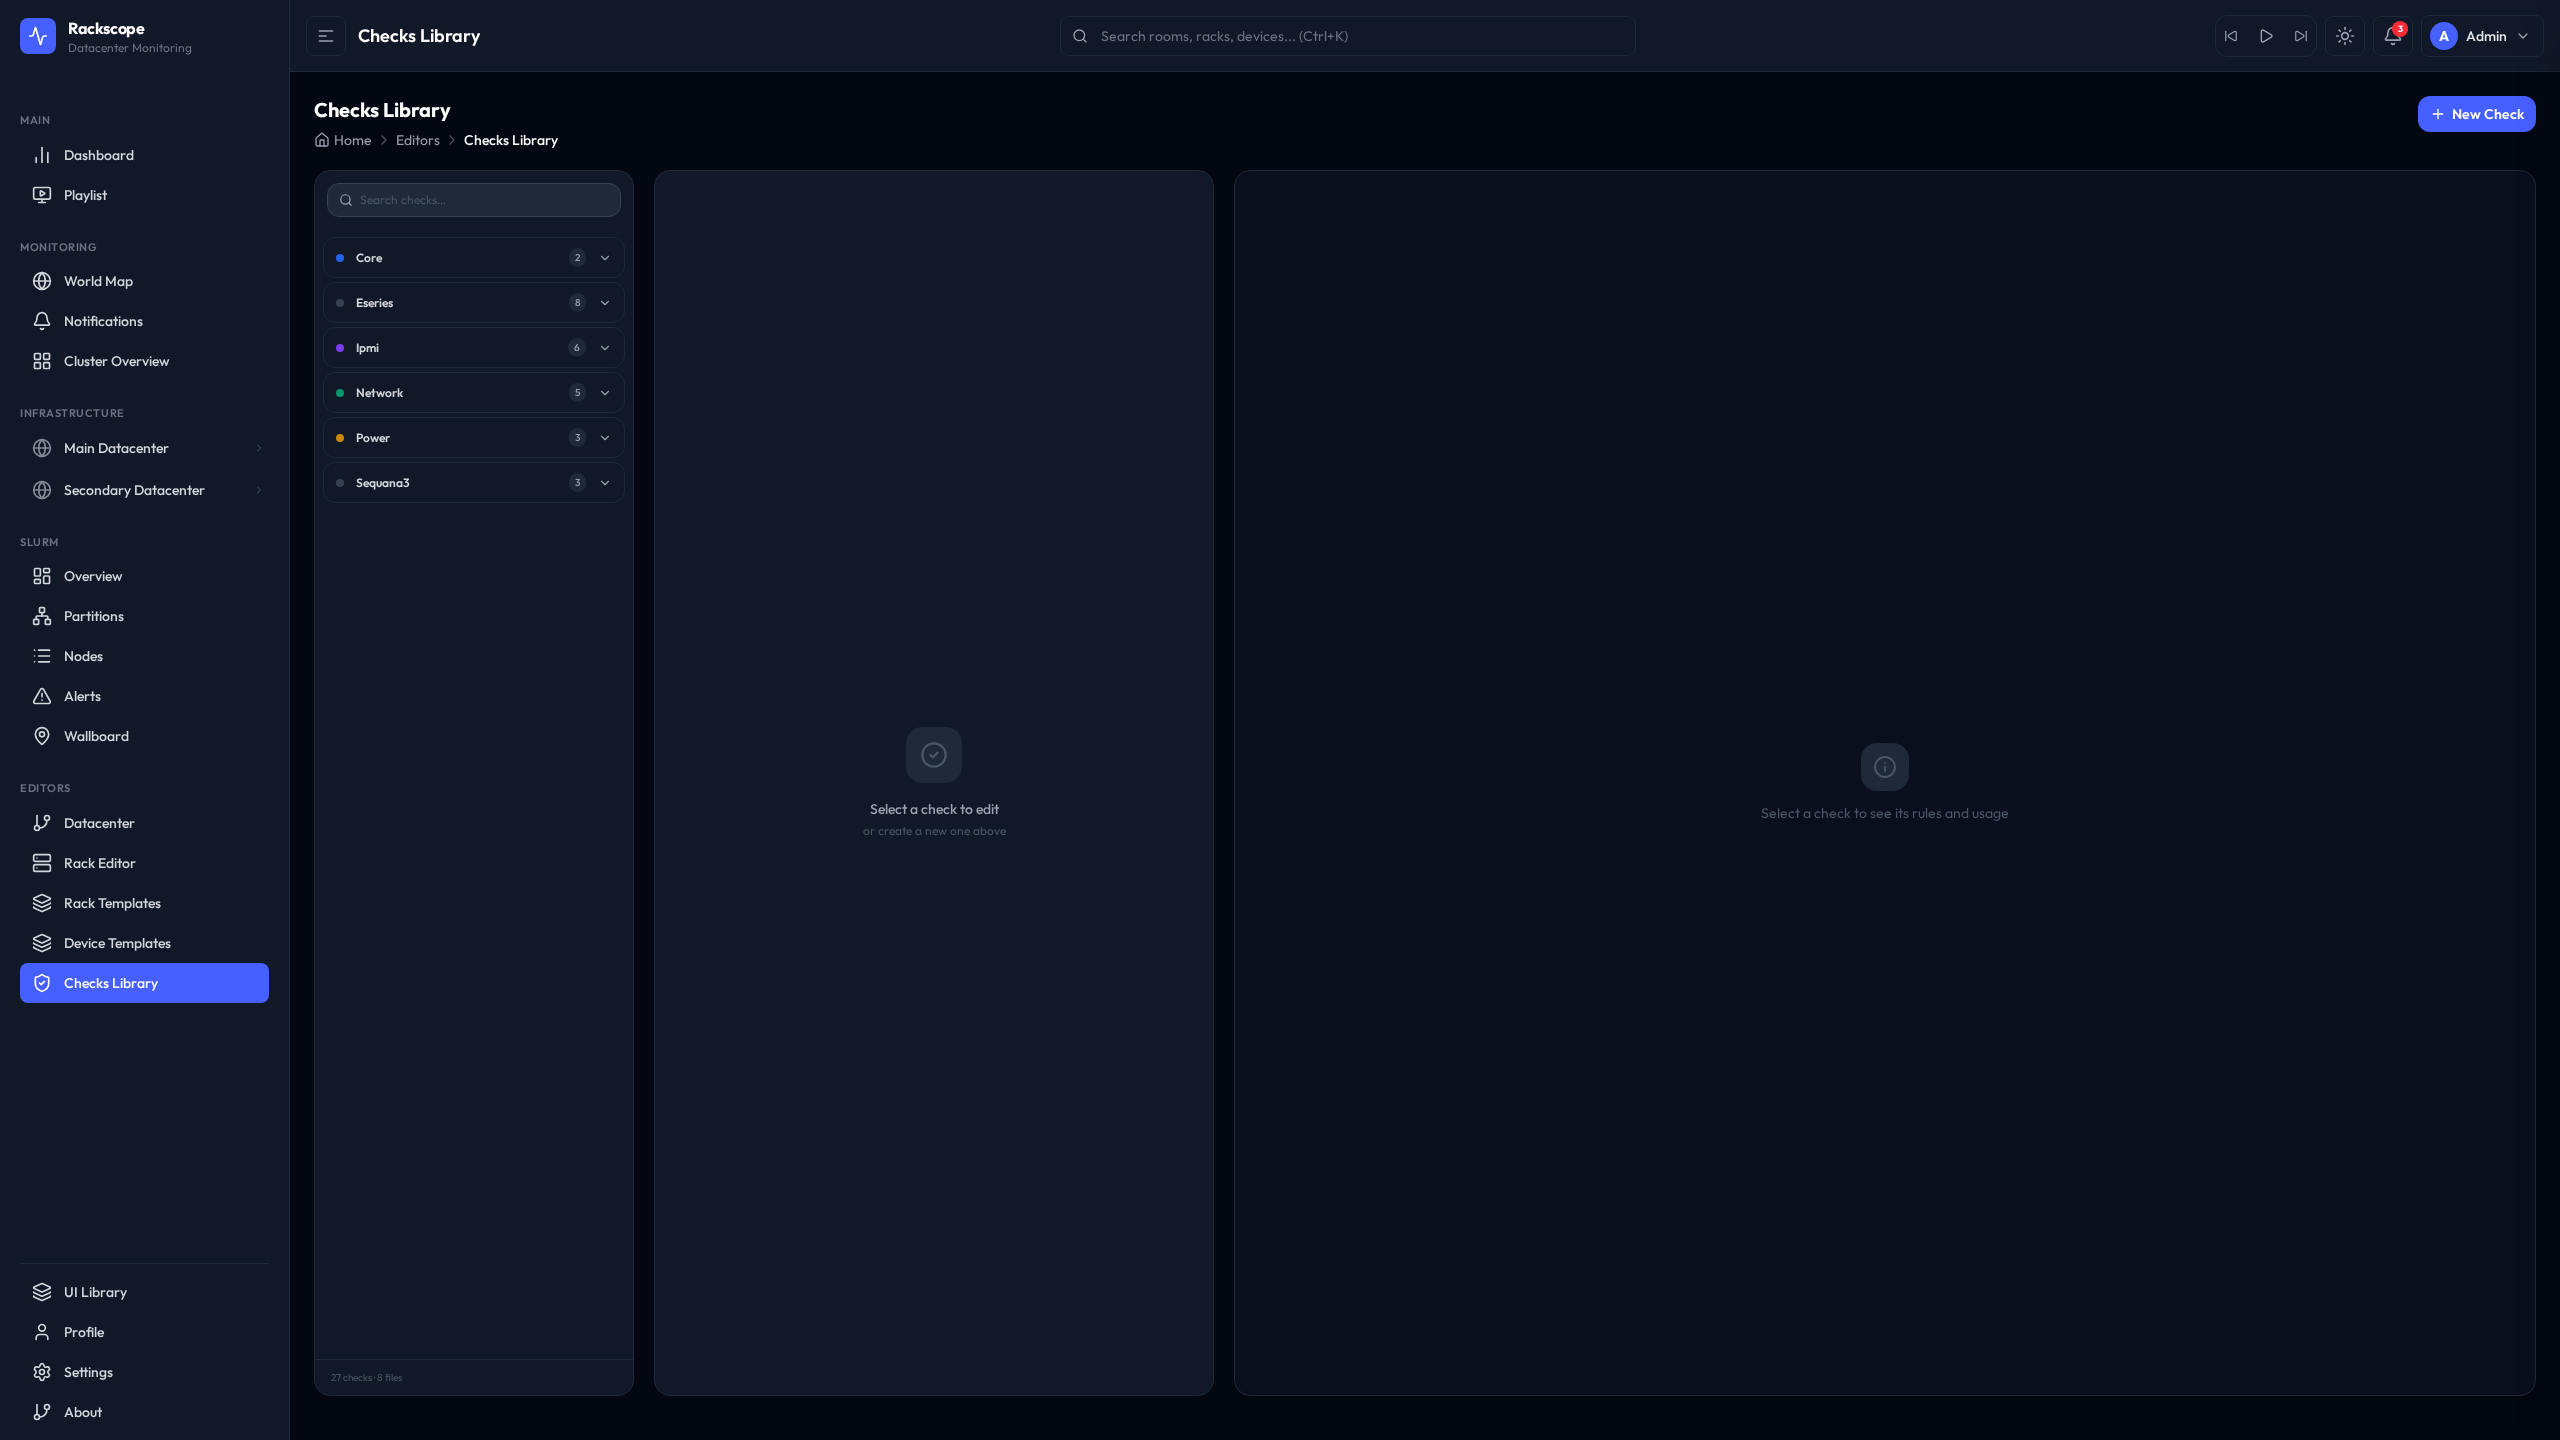
Edit health check definitions:
- PromQL expressions
- Severity thresholds
- Device type filters
Metrics Library Editor
URL: /editors/metrics
Manage the metrics library — the catalog of Prometheus queries displayed in device and rack tooltips, detail panels, and charts.
The editor uses a 3-column layout:
| Column | Content |
|---|---|
| Left | Scrollable list of all metric definitions, searchable by name or category |
| Center | Form editor: name, description, PromQL expression, unit, chart type, thresholds |
| Right | Context panel with a live chart preview — executes the PromQL against the current Prometheus and renders the result |
What you can do
- Add new metrics (name, PromQL expression, display unit, category, tags)
- Edit threshold values (
warn/crit) that colour the arc gauge in tooltips - Change the chart type (
gauge,bar,number,line) - Delete unused metrics
- Preview the query result before saving (live preview in context panel)
Relationship to templates
Metrics are referenced by id in device and rack component templates:
# In a device template:
metrics:
  - node_temperature   # ← id from metrics library
  - node_power
Adding a metric to the library makes it available for templates to reference. The metric only appears in the UI if a device template includes its id.
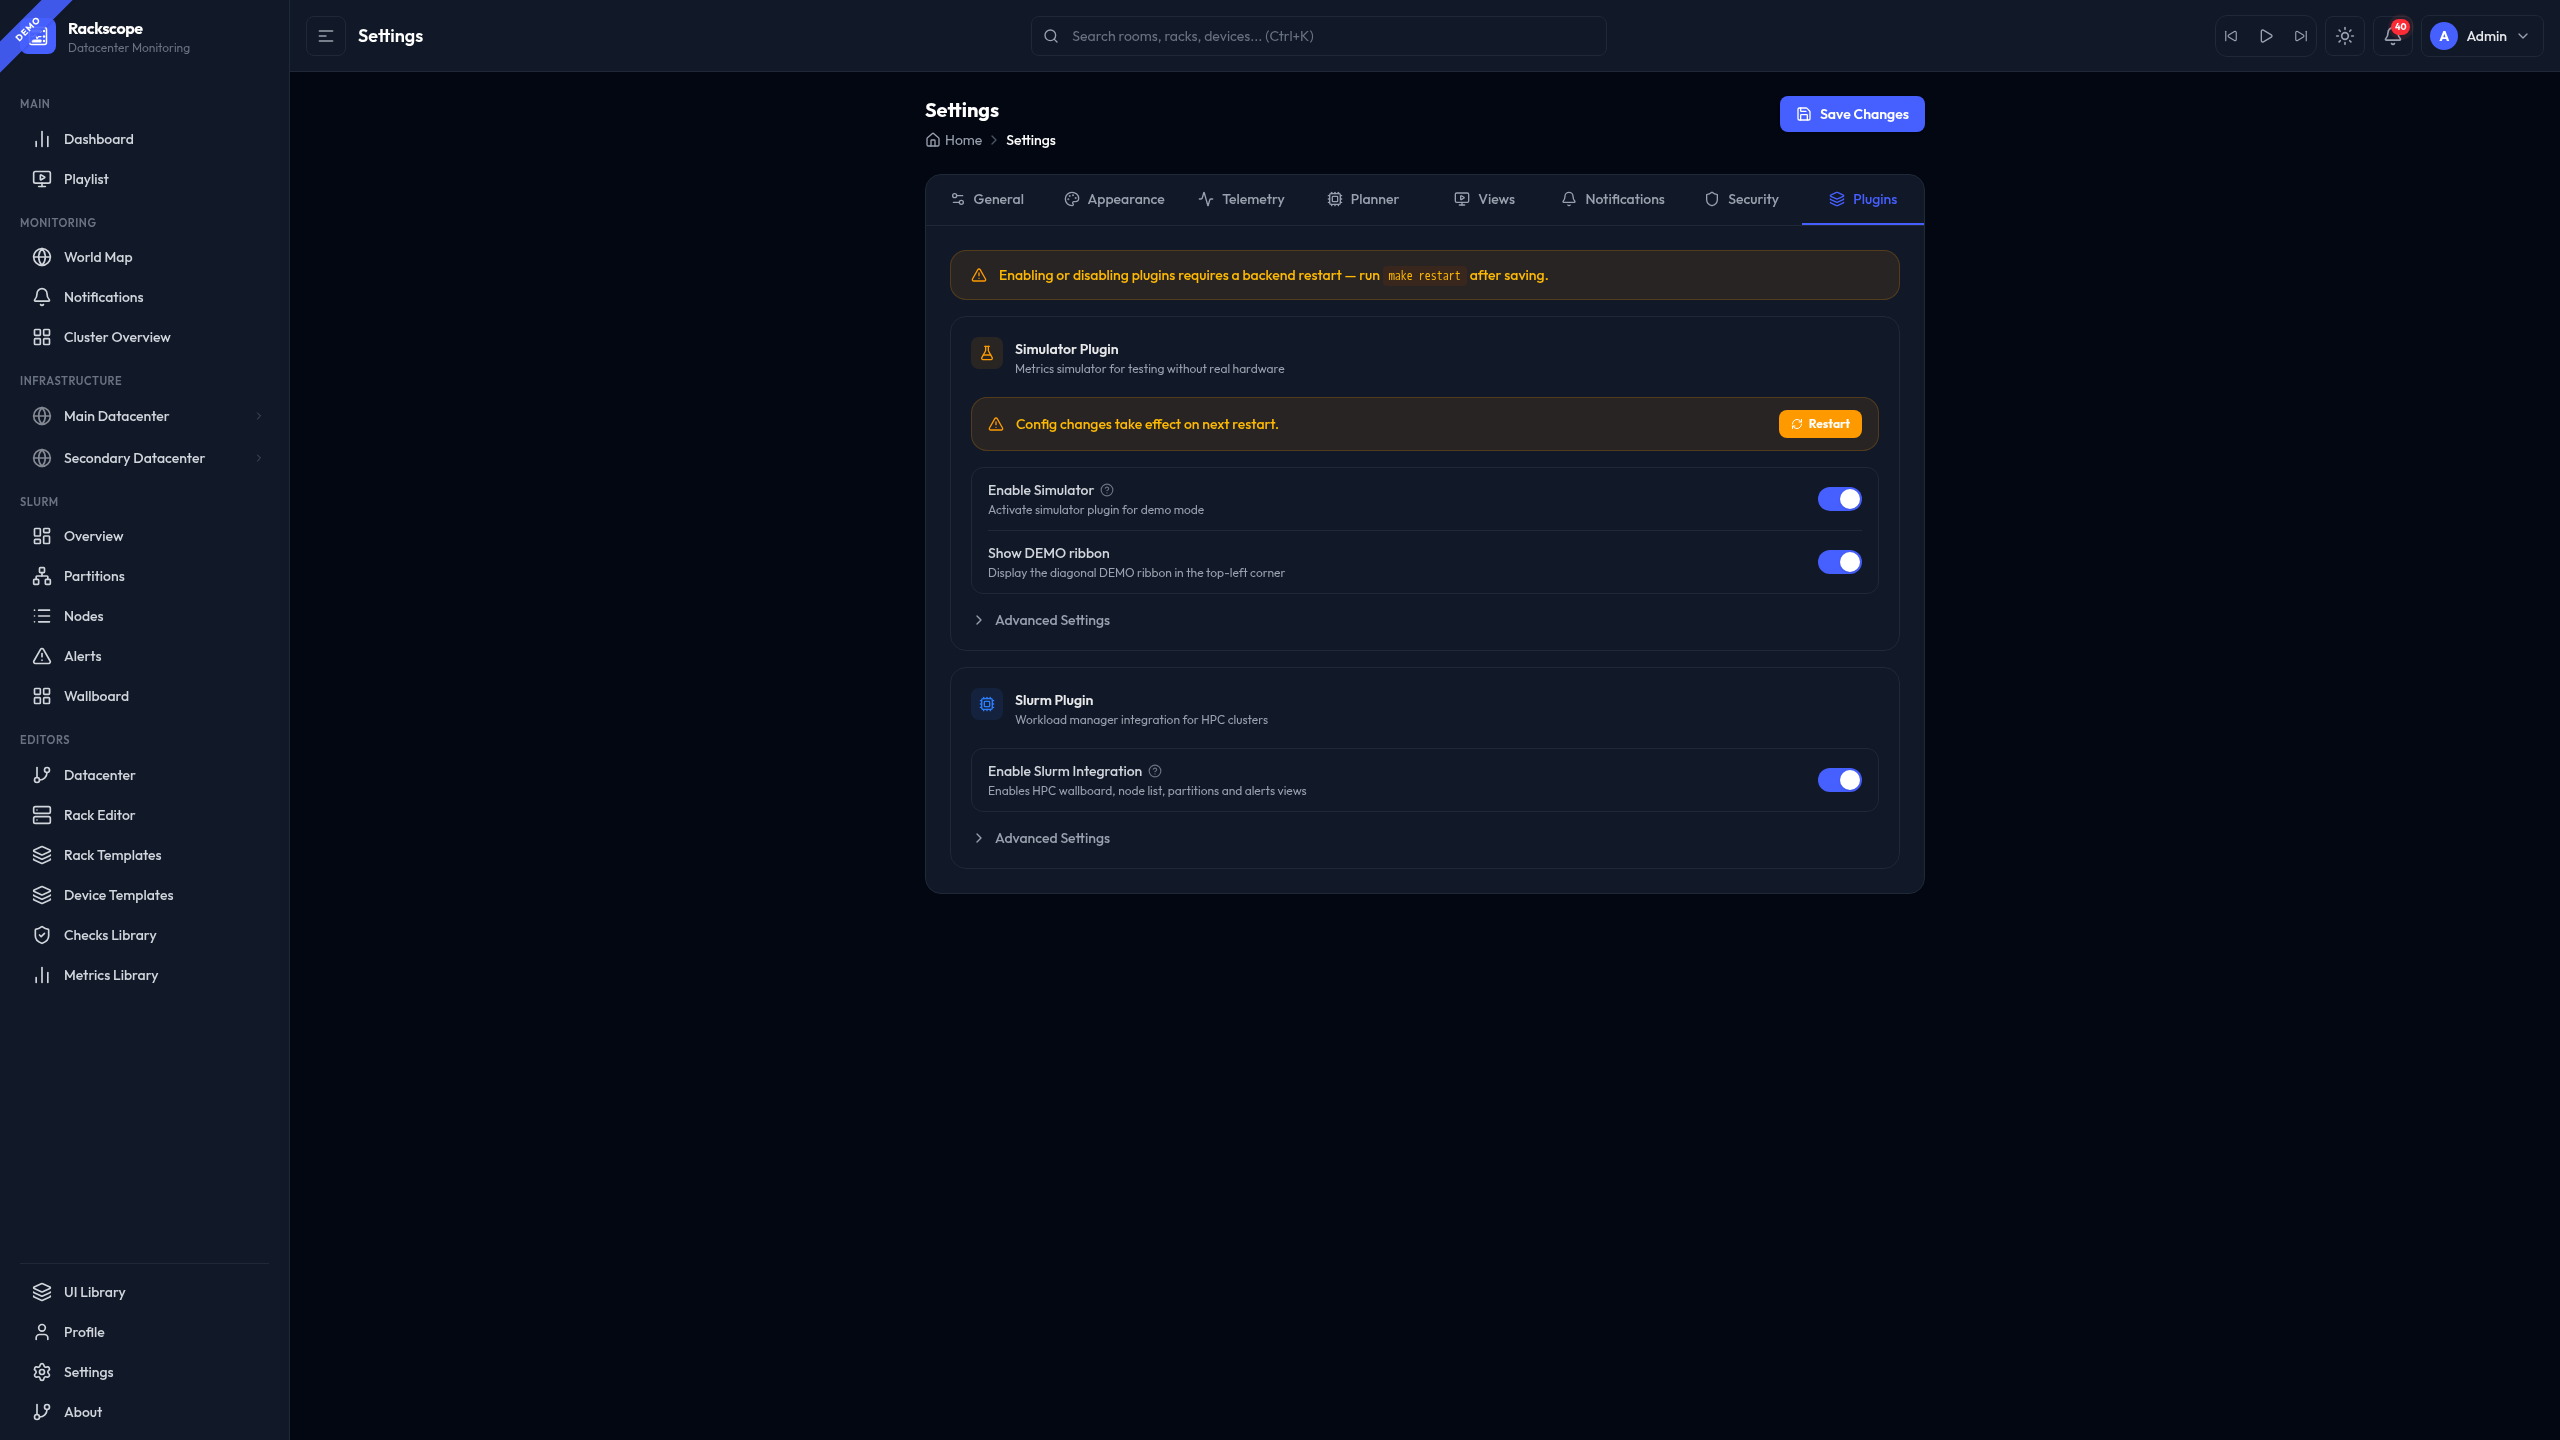
Settings
URL: /editors/settings (or /settings)
Configure application settings:
- Prometheus connection
- Plugins (Simulator, Slurm)
- Refresh intervals
- View preferences (tooltip style, map style)