Metrics Simulator
The Rackscope Simulator generates realistic Prometheus metrics for development, testing, and presentations without any real hardware. Prometheus scrapes it on its normal schedule; the backend queries Prometheus exactly as in production — the simulator is completely transparent to the rest of the stack.
Architecture: Two Independent Systems
The simulator involves two completely separate concepts that are often confused. Understanding the distinction is critical before making any configuration change.
Simulator Catalog — What Gets Generated
File: config/plugins/simulator/metrics/metrics_full.yaml
The metrics catalog defines which Prometheus metrics the simulator
generates and exposes on :9000. It controls metric names, label sets,
instance filtering, and how the simulator engine populates values (from
behavioral profiles, incidents, and overrides).
The catalog is read by plugins/simulator/process/main.py on every tick. Changes to
it do not affect what the UI displays — only what Prometheus scrapes.
The default catalog (metrics_full.yaml) produces 43 distinct metric
families grouped by exporter:
| Group | Metric prefix | Notes |
|---|---|---|
| Simulator synthetic | up, node_temperature_celsius, node_power_watts, node_load_percent, node_health_status | Derived from behavioral profiles |
| Node Exporter — CPU | node_cpu_seconds_total | Monotonic idle counter |
| Node Exporter — Memory | node_memory_MemTotal_bytes, node_memory_MemAvailable_bytes | |
| Node Exporter — Filesystem | node_filesystem_size_bytes, node_filesystem_avail_bytes | mountpoint=/ |
| Node Exporter — Disk I/O | node_disk_read_bytes_total, node_disk_written_bytes_total | device=sda |
| Node Exporter — Network | node_network_receive_bytes_total, node_network_transmit_bytes_total | device=eth0 |
| IPMI | ipmi_fan_speed_state, ipmi_power_state, ipmi_sensor_state, ipmi_temperature_state, ipmi_voltage_state, ipmi_up | compute/visu/srv/service only |
| Switches | switch_port_oper_status, switch_port_in_octets, switch_port_out_octets | *isw*, *esw*, sw-* |
| Slurm | slurm_node_status | compute/visu, labels_only |
| E-Series storage | eseries_* (8 metrics) | da*-r02-* pattern |
| Sequana3 HYC | sequana3_hyc_* (4 metrics) | r01-* racks |
| Sequana3 PMC | sequana3_pmc_total_watt | r01-* racks |
| Raritan PDU | raritan_pdu_* (6 metrics) | all racks |
Display Library — How Metrics Are Shown
Directory: config/metrics/library/
The display library defines how the UI renders metrics in charts: units, axis labels, colors, thresholds, and chart types. It does not affect which metrics the simulator generates.
The default library ships with 7 display metrics: node_temperature,
node_power, pdu_active_power, pdu_apparent_power, pdu_current,
pdu_voltage, and pdu_energy.
Adding a metric to the display library does not make the simulator generate it. Adding a metric to the simulator catalog does not make the UI show a chart for it. Both must be configured independently.
Folder Structure
config/plugins/simulator/
├── config/
│   └── plugin.yaml          ← single config file (hot-reloaded every tick)
├── metrics/
│   ├── metrics_full.yaml    ← primary catalog (all 43 metric families)
│   ├── metrics_slurm.yaml   ← Slurm-only catalog (labels_only format)
│   └── metrics_examples.yaml ← reference examples for custom catalogs
└── overrides/
    └── overrides.yaml       ← runtime metric overrides (TTL-aware)
How It Works: The Tick Loop
The simulator runs a continuous loop. On every tick:
Every N seconds (update_interval_seconds, default: 20):

  1. Reload plugin.yaml
     Hot-reload: changes take effect on the next tick without restarting.

  2. Load topology
     Discovers all instances (compute nodes, switches, storage arrays, PDUs)
     from the YAML topology files mounted into the simulator container.

  3. Load overrides (with TTL expiration)
     Reads config/plugins/simulator/overrides/overrides.yaml.
     Overrides with expires_at in the past are silently skipped.

  4. Roll incidents (on cycle boundary)
     Every `3600 / changes_per_hour / update_interval` ticks, a new random set
     of victims is drawn from the topology according to the active incident_mode:
     - nodes_crit  → up=0, Slurm=down
     - nodes_warn  → health_status=1, Slurm=drain
     - racks_crit  → all nodes in rack go down
     - aisles_hot  → +12 °C temperature boost on all nodes in aisle

  5. Generate metrics
     For each discovered instance, compute gauge values based on the
     active behavioral profile, any active incidents, and overrides.

  6. Expose on :9000
     All gauges are registered with the prometheus_client library and
     served at http://simulator:9000/metrics in Prometheus text format.

  7. Prometheus scrapes :9000
     The Prometheus container scrapes the simulator at its configured
     interval. The backend then queries Prometheus with PromQL exactly
     as it would against production exporters.
Enabling Demo Mode
Enabling the simulator requires a single setting in config/app.yaml.
The features.demo flag no longer exists — the simulator plugin is fully
self-contained.
config/app.yaml:
plugins:
  simulator:
    enabled: true
When the simulator is active, a small DEMO ribbon appears in the top-left corner of the UI as a visual indicator.
config/plugins/simulator/config/plugin.yaml (authoritative config,
hot-reloaded every tick):
update_interval_seconds: 20
seed: null
incident_mode: light   # full_ok | light | medium | heavy | chaos | custom
changes_per_hour: 2
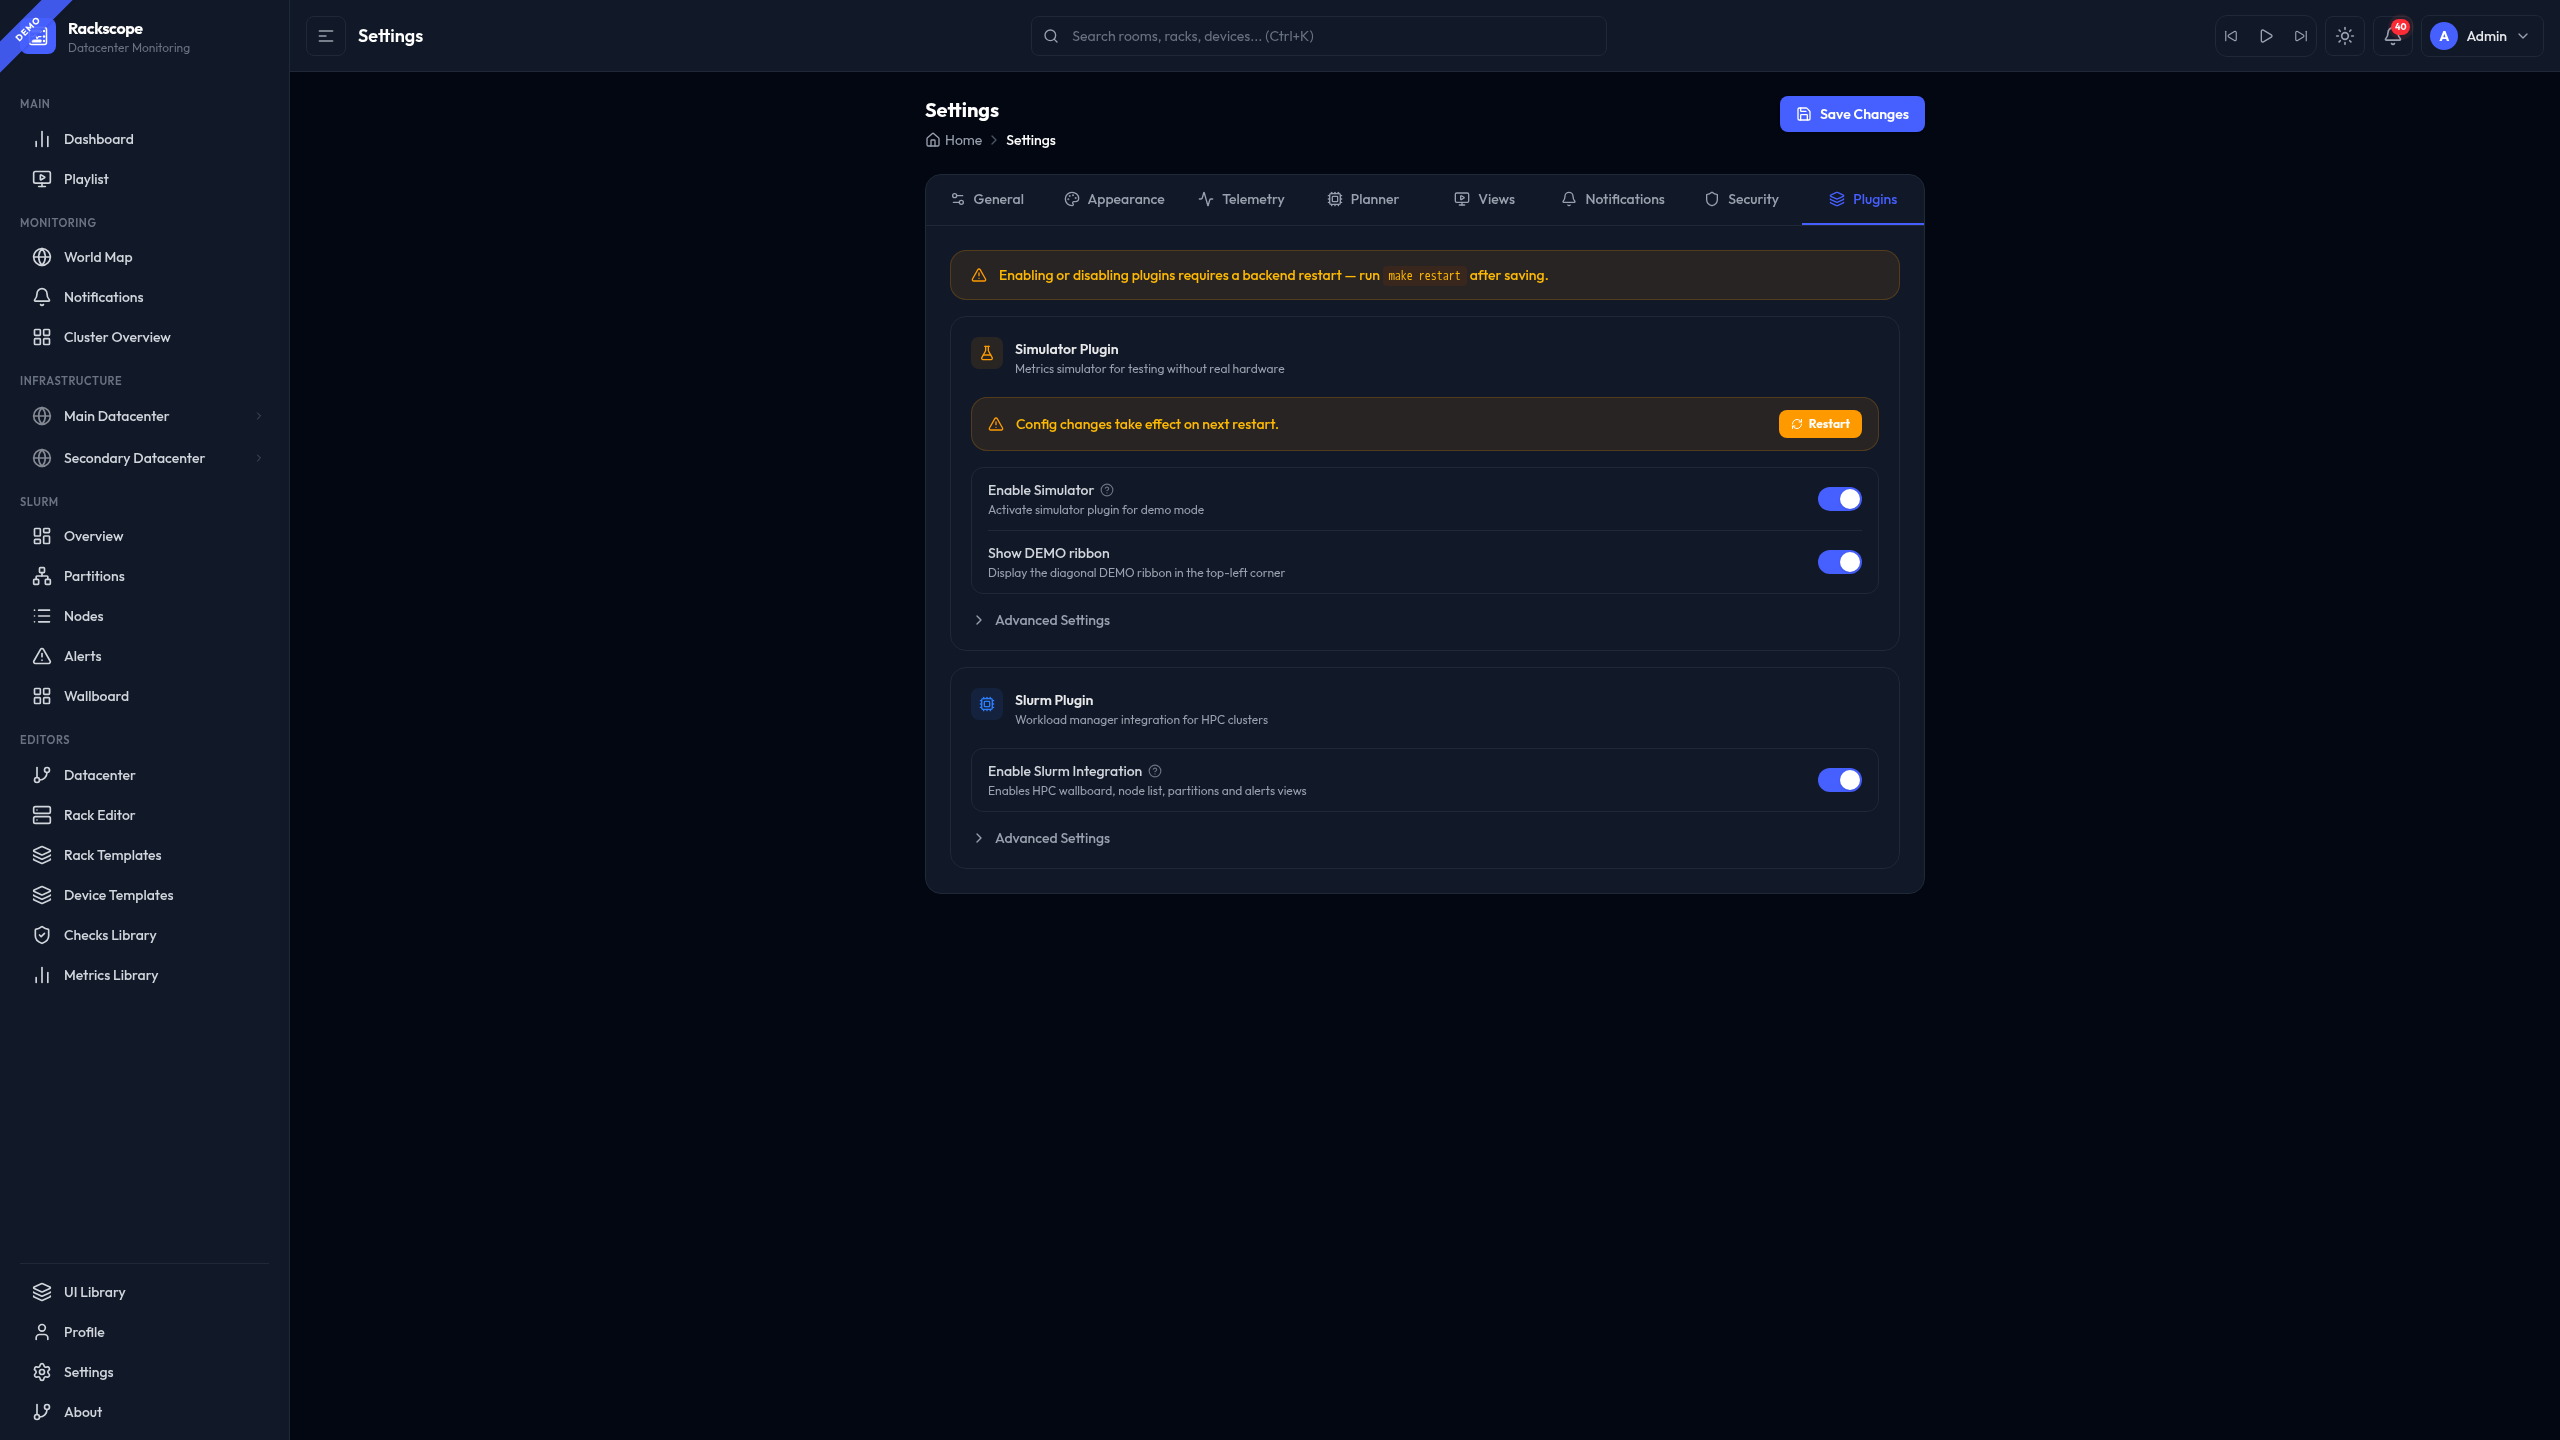
Alternatively, navigate to Settings in the UI, find the
Plugins — Simulator section, and use the Enable toggle and incident mode
selector. Settings are written back to plugin.yaml and app.yaml immediately.
plugin.yaml is re-read on every simulator tick. You can edit it while
the stack is running and the change will take effect within one tick
(default: 20 seconds). No container restart is required.
Incident Modes
The incident_mode field selects a named failure preset. On each reshuffle
cycle, the simulator draws a new random set of victims within the configured
bounds. The reshuffle frequency is controlled by changes_per_hour.
Available Modes
| Mode | Nodes CRIT | Nodes WARN | Racks CRIT | Aisles hot | Best for |
|---|---|---|---|---|---|
full_ok | 0 | 0 | 0 | 0 | Baseline demos, UI walkthroughs, testing normal state |
light | 1–3 | 1–5 | 0 | 0 | Day-to-day development, standard demos |
medium | 1–3 | 5–10 | 1 | 0 | Testing health aggregation, rack-level propagation |
heavy | 5–10 | 10–20 | 2 | 1 | Stress-testing the dashboard, aisle cooling scenarios |
chaos | 15 % | 25 % | 20 % | 25 % | Maximum churn, NOC operator training |
custom | configurable | configurable | configurable | configurable | Reproducible exact-count scenarios |
Changing the Incident Mode
Via the Settings UI (recommended):
Navigate to Settings → Plugins → Simulator → Advanced → Incident Mode and select from the dropdown. The change is hot-reloaded within one tick.
Via plugin.yaml (hot-reloaded every tick):
# config/plugins/simulator/config/plugin.yaml
incident_mode: heavy
changes_per_hour: 4
Custom Mode
When incident_mode: custom, the simulator uses exact counts from
custom_incidents:
incident_mode: custom
changes_per_hour: 2
custom_incidents:
  devices_crit: 5
  devices_warn: 10
  racks_crit: 1
  aisles_hot: 0
Behavioral Profiles
Behavioral profiles define the baseline characteristics of different node types. The simulator assigns each instance to a profile based on its name and then generates metric values by sampling from the profile's ranges.
Profile Definitions (from plugin.yaml)
| Profile | base_temp | temp_range | base_power | power_var | load_min | load_max |
|---|---|---|---|---|---|---|
compute | 24 °C | ±8 °C | 200 W | ±200 W | 40 % | 80 % |
gpu | 28 °C | ±25 °C | 250 W | ±500 W | 5 % | 100 % |
service | 21 °C | ±3 °C | 100 W | ±20 W | 2 % | 8 % |
network | 32 °C | ±4 °C | 120 W | ±10 W | 15 % | 15 % |
Profile assignment rules (evaluated in order, first match wins):
- Instance name matches
gpu*→gpu - Instance name matches
login*,mngt*,srv*,service*→service - Instance name matches
sw-*,*isw*,*esw*→network - Everything else →
compute
Profile values can be customized in plugin.yaml under the profiles key.
These are process-only fields (not validated by the backend Pydantic model).
Incident Effects
Regardless of the active mode, all four incident types have the same observable effects:
Critical nodes (nodes_crit)
Nodes drawn into the CRIT set:
upset to0node_health_statusset to2(CRIT)- Power drops to 50 W (standby/BMC-only draw)
- CPU load drops to 0
- Slurm status:
down
Warning nodes (nodes_warn)
Nodes drawn into the WARN set:
upremains1node_health_statusset to1(WARN)- Temperature, power and load unaffected
- Slurm status:
drain
Critical racks (racks_crit)
All nodes in a CRIT rack receive the same treatment as nodes_crit above. Additionally, the rack cooling metrics (Sequana3) show:
- Inlet pressure drops to ~160 kPa
- Leak sensor reads ~1.2
- Board temperature rises to ~95 °C
- PMC power output drops to 0 W
Hot aisles (aisles_hot)
All nodes in a hot aisle receive a +12 °C temperature boost:
- Temperatures exceed WARN threshold (typically 38 °C) on most nodes
- High-draw nodes (GPU) may exceed CRIT threshold (45 °C)
upis NOT affected — nodes remain reachable- Aisle cooling (Sequana3) shows reduced pressure and elevated leak sensor
Metrics Catalog
Catalog Files
metrics_full.yaml — Primary catalog for the default demo topology.
Covers all 43 metric families: node exporter, IPMI, switches, Slurm,
E-Series, Sequana3, and Raritan PDU. This is the file used by default.
metrics_slurm.yaml — Standalone Slurm catalog. Use this when you
want Slurm metrics (slurm_node_status) without the full E-Series and
Sequana3 families, for example on a simple air-cooled topology with no
storage arrays.
metrics_examples.yaml — Not loaded in production. Contains annotated
examples of every catalog feature: static labels, $placeholder variables,
labels_only, rack-scoped metrics, and explicit instance lists vs wildcard
patterns. Start here when writing a custom catalog.
Catalog Entry Schema
metrics:
  - name: metric_name          # Prometheus metric name (required)
    scope: node | rack         # Evaluation scope (required)
    instances: ["pattern"]     # fnmatch patterns — node-scoped only
    racks: ["pattern"]         # fnmatch patterns — rack-scoped only
    labels:                    # Extra label key=value pairs (optional)
      key: $placeholder        # $var resolved at generation time
      key: literal_value       # static label value
    labels_only: true          # Omit BASE_LABELS (see below)
Instance and Rack Patterns
Patterns follow fnmatch syntax:
| Pattern | Matches |
|---|---|
"*" | All instances |
"compute*" | Instances starting with compute |
"*isw*" | Instances containing isw (InfiniBand switches) |
"da*-r02-*" | E-Series arrays in rack group r02 |
"compute[001-010]" | Expanded range: compute001 through compute010 |
BASE_LABELS
Unless labels_only: true is set, the simulator automatically adds the
following topology context labels to every node-scoped metric:
site_id, room_id, rack_id, chassis_id, node_id, instance, job
These labels allow Rackscope's health checks to filter metrics by topology
position (e.g. up{rack_id="r01-01"}).
labels_only Mode
Use labels_only: true when the target metric must match a real exporter
format that does NOT include topology labels. The primary example is
slurm_node_status from slurm_exporter:
- name: slurm_node_status
  scope: node
  instances: ["compute*", "visu*"]
  labels_only: true     # Only emit the labels defined below
  labels:
    node: $node_id
    partition: $partition
    status: $status
Real output matches the exporter exactly:
slurm_node_status{node="compute001",partition="compute",status="idle"} 1
Available Placeholders
Placeholders in label values are resolved at metric generation time:
| Placeholder | Resolved to |
|---|---|
$node_id | Instance name (e.g. compute001) |
$rack_id | Rack identifier (e.g. r01-01) |
$status | Inferred state (optimal/degraded/failed for storage; idle/allocated/drain for Slurm) |
$port | Port number (for switch port metrics) |
$cpu | CPU index |
$pduid | PDU unit identifier |
$pduname | PDU unit name |
$inletid | PDU inlet identifier (e.g. I1, I2) |
$drive_id | E-Series drive identifier |
$slot | Slot number |
$tray | Tray number |
$partition | Slurm partition name |
$state | Sequana3 HYC state string |
Runtime Overrides
Overrides allow you to force specific metric values for any instance or rack at runtime — without touching any configuration file. This is the primary mechanism for interactive demos and failure injection during presentations.
Overrides are persisted to
config/plugins/simulator/overrides/overrides.yaml and survive backend
restarts. The simulator reads this file on every tick and applies
overrides before generating the final metric values.
TTL Rules
ttl_seconds: 0— Permanent. The override stays until manually deleted via the API or the Settings UI.ttl_seconds: 300— Expires after 5 minutes. The simulator skips expired overrides without deleting the file.- No
ttl_secondsin the request — the backend usesdefault_ttl_secondsfromplugin.yaml(default: 120 seconds).
Common Override Examples
Force a node down permanently:
curl -X POST http://localhost:8000/api/simulator/overrides \
  -H "Content-Type: application/json" \
  -d '{"instance": "compute001", "metric": "up", "value": 0, "ttl_seconds": 0}'
Spike temperature for 5 minutes:
curl -X POST http://localhost:8000/api/simulator/overrides \
  -H "Content-Type: application/json" \
  -d '{"instance": "compute001", "metric": "node_temperature_celsius", "value": 92, "ttl_seconds": 300}'
Set a node into WARN health state:
curl -X POST http://localhost:8000/api/simulator/overrides \
  -H "Content-Type: application/json" \
  -d '{"instance": "compute001", "metric": "node_health_status", "value": 1, "ttl_seconds": 0}'
Take down an entire rack for 2 minutes:
curl -X POST http://localhost:8000/api/simulator/overrides \
  -H "Content-Type: application/json" \
  -d '{"rack_id": "r02-01", "metric": "rack_down", "value": 1, "ttl_seconds": 120}'
List all active overrides:
curl http://localhost:8000/api/simulator/overrides
Delete a specific override (use the id field from the list response):
curl -X DELETE http://localhost:8000/api/simulator/overrides/compute001-up-1770032278
Clear all overrides:
curl -X DELETE http://localhost:8000/api/simulator/overrides
Overridable Metrics
The following metrics can be set via the override API:
| Metric | Valid values | Notes |
|---|---|---|
up | 0 or 1 | Node reachability |
rack_down | 0 or 1 | Requires rack_id, not instance |
node_temperature_celsius | Any float | Degrees Celsius |
node_power_watts | Any float | Watts |
node_load_percent | Any float | 0–100 |
node_health_status | 0, 1, or 2 | 0=OK, 1=WARN, 2=CRIT |
Any metric defined in the display library (config/metrics/library/) is
also accepted.
Slurm Integration
When the Slurm plugin is enabled alongside the Simulator, the simulator injects random Slurm node status transitions every tick to populate the Slurm wallboard and dashboards with realistic data.
The slurm_random_statuses block in plugin.yaml controls how many
nodes are randomly placed into each non-idle state per tick:
# config/plugins/simulator/config/plugin.yaml
slurm_random_statuses:
  drain: 1   # 1 random node set to drain each tick
  down: 1    # 1 random node set to down each tick
  maint: 1   # 1 random node set to maint each tick

slurm_random_match:
  - compute*   # Only apply to nodes matching these patterns
  - visu*
These Slurm statuses are generated via slurm_node_status metrics with
labels_only: true. The Rackscope backend queries them with the standard
PromQL: slurm_node_status{node=~"..."} — exactly the same query used
against a real slurm_exporter.
Custom Metrics Catalog
When to Use a Custom Catalog
- Your topology has hardware not covered by the default catalog (e.g. a different storage vendor, custom health exporter)
- You want to reduce the number of generated metrics for a lighter demo
- You have a standalone topology with no E-Series or Sequana3 hardware
Adding a Custom Catalog
-
Copy
config/plugins/simulator/metrics/metrics_examples.yamlto a new file (e.g.config/plugins/simulator/metrics/my_metrics.yaml). -
Define your metrics using the schema described in the Metrics Catalog section above. Use
metrics_examples.yamlas a reference for all supported patterns. -
Add the new catalog to
plugin.yaml:
# config/plugins/simulator/config/plugin.yaml
metrics_catalog_path: config/plugins/simulator/metrics/metrics_full.yaml

metrics_catalogs:
  - id: my_hardware
    path: config/plugins/simulator/metrics/my_metrics.yaml
    enabled: true
Additional catalogs are merged on top of the primary. When two catalogs
define an entry with the same name, the later entry (higher in the list)
takes precedence.
- The change takes effect on the next simulator tick — no restart needed.
Replacing the Primary Catalog
For a minimal deployment (e.g. Slurm-only demo without any storage metrics):
# config/plugins/simulator/config/plugin.yaml
metrics_catalog_path: config/plugins/simulator/metrics/metrics_slurm.yaml
metrics_catalogs: []
Discovering Available Metrics
To list all metrics that the display library can render (used by the Settings UI override form):
curl http://localhost:8000/api/simulator/metrics
To see raw Prometheus output from the simulator directly:
curl http://localhost:9000/metrics
To check whether the simulator is running and what scenario is active:
curl http://localhost:8000/api/simulator/status