Health Checks
Health checks are the core of Rackscope's monitoring system. They define PromQL queries that are evaluated against Prometheus data to determine the health state (OK / WARN / CRIT / UNKNOWN) of every device and rack in your infrastructure.
Rackscope does not collect metrics itself. Every check is a live PromQL query sent to your Prometheus instance. The check system is entirely configuration-driven: checks are defined in YAML, bound to hardware templates, and evaluated in batches by the Telemetry Planner to avoid query explosion.
How Health Checks Work
The evaluation pipeline for a single device is:
- The Telemetry Planner collects all node IDs for every check that is referenced by at least one device template currently loaded in the topology.
- For each check, it builds a batch PromQL query replacing placeholders (
$instances,$chassis,$racks,$jobs) with the relevant IDs from the topology. - The query result is a Prometheus instant vector. Each returned time series is matched against the check's
ruleslist in order. - The first rule whose condition is satisfied sets the health state for that time series. If no rule matches, the state is OK.
- If a node is absent from the query result (no data), its state is UNKNOWN (or the configured
unknown_state). - States are aggregated upward through the physical hierarchy (see section below).
Because queries are batched across all nodes, a single Prometheus query can cover an entire aisle of hundreds of servers. Rackscope never sends one query per device.
Health State Aggregation
Health states propagate from individual instances up to the top of the hierarchy. At every level, the worst state wins.
Instance (Prometheus node)
    ↓  worst state
Device (chassis node, slot)
    ↓  worst state
Rack
    ↓  worst state
Room
    ↓  worst state
Site
The severity order from worst to best is:
| State | Priority | Meaning |
|---|---|---|
| CRIT | 1 (worst) | At least one critical check failed |
| WARN | 2 | At least one warning check failed, no CRIT |
| UNKNOWN | 3 | No data returned or check error |
| OK | 4 (best) | All checks pass |
Example: A rack containing 40 nodes where 1 node has an IPMI temperature CRIT and 3 nodes have fan speed WARNs will display as CRIT at the rack level. Drilling down to the rack view reveals which device is CRIT; drilling into the device shows which check triggered it.
Check File Layout
Checks are organized in a folder-based library under config/checks/library/. Each file groups related checks by hardware family:
config/checks/library/
  up.yaml          # Core availability (node_up, recent reboot)
  ipmi.yaml        # IPMI hardware sensors
  eseries.yaml     # NetApp E-Series storage
  pdu.yaml         # PDU power monitoring
  switch.yaml      # Network switch health
Each file has the structure:
checks:
  - id: my_check_id
    name: Human readable name
    scope: node
    kind: server
    expr: my_metric{instance=~"$instances"}
    output: bool
    rules:
      - op: "=="
        value: 0
        severity: CRIT
Multiple check files are merged at startup into a single ChecksLibrary in memory. The id field must be globally unique across all files.
Check Field Reference
id
Type: string — Required
Unique identifier for this check across the entire library. Used to bind checks to templates via the checks: list on a DeviceTemplate or RackTemplate.
id: node_up
Convention: use snake_case, prefix with the subsystem name (ipmi_, eseries_, pdu_).
name
Type: string — Required
Human-readable display name shown in the UI (Checks Editor, device detail view, alert lists).
name: Node up
scope
Type: "node" | "chassis" | "rack" — Required
Controls which set of IDs is substituted into the PromQL placeholder:
| Scope | Placeholder | Description |
|---|---|---|
node | $instances | Individual Prometheus instance names (one per compute node, storage controller, etc.) |
chassis | $chassis | Chassis identifiers for multi-node devices |
rack | $racks | Rack identifiers for infrastructure-level checks (PDUs, cooling) |
A node-scoped check runs once per device and evaluates the health of individual instances. A rack-scoped check evaluates infrastructure attached to the rack as a whole.
kind
Type: string | null — Optional
A grouping tag used for filtering and display in the UI. Common values used in the built-in library:
| Kind | Used for |
|---|---|
core | Basic availability checks (node_up, reboot) applied to all servers |
ipmi | IPMI hardware sensor checks |
eseries | NetApp E-Series storage checks |
server | General server health checks |
switch | Network switch checks |
storage | Generic storage checks |
pdu | Power distribution unit checks |
cooling | Cooling and thermal checks |
network | Network interface checks |
The kind field is free-form — you can define your own values for custom check families.
expr
Type: string — Required
A PromQL expression with Rackscope placeholders. The Telemetry Planner replaces placeholders with actual IDs from the topology before sending the query to Prometheus.
Placeholders:
| Placeholder | Replaced with | Example result |
|---|---|---|
$instances | node01|node02|node03|... | up{instance=~"node01|node02|node03"} |
$chassis | Chassis IDs | chassis_metric{chassis=~"chassis01|chassis02"} |
$racks | Rack IDs | pdu_power{rack=~"r01-01|r01-02"} |
$jobs | Slurm job IDs | slurm_job_state{job=~"12345|12346"} |
The instance=~"$instances" pattern is the most common. It matches any instance whose name is in the batched regex. Never use a static instance name in a check expression — always use a placeholder.
# Good: uses placeholder, works for any number of nodes
expr: up{job=~"$jobs",instance=~"$instances"}

# Good: filters on a label in addition to the instance set
expr: ipmi_sensor_state{name!~"Low Security Jmp|Phy Presence Jmp",instance=~"$instances"}

# Bad: hardcoded instance (will never match other nodes)
expr: up{instance="compute001"}
output
Type: "bool" | "numeric" — Default: "bool"
Describes how the query result value should be interpreted when evaluating rules:
bool: The metric is expected to be0(false/unhealthy) or1(true/healthy). Rules typically check== 0for CRIT.numeric: The metric represents a quantitative state code or measured value. Rules use comparison operators against thresholds.
# Bool: metric is 0 when down
output: bool
rules:
  - op: "=="
    value: 0
    severity: CRIT

# Numeric: metric encodes 0=OK, 1=WARN, 2=CRIT
output: numeric
rules:
  - op: "=="
    value: 1
    severity: WARN
  - op: "=="
    value: 2
    severity: CRIT
rules
Type: list[CheckRule] — Optional (empty list = always OK if metric is present)
An ordered list of threshold rules evaluated top-to-bottom. The first rule that matches determines the severity. If no rule matches, the state is OK.
Each rule has three fields:
| Field | Type | Description |
|---|---|---|
op | string | Comparison operator: ==, !=, >, >=, <, <= |
value | number or string | Threshold value to compare against |
severity | string | State to assign: OK, WARN, CRIT, or UNKNOWN |
Rule operator examples:
# Exact match: state code == 2 → CRIT
- op: "=="
  value: 2
  severity: CRIT

# Not equal: any non-zero state → WARN
- op: "!="
  value: 0
  severity: WARN

# Threshold: temperature < 600 seconds since boot → WARN (recent reboot)
- op: "<"
  value: 600
  severity: WARN

# Range: use two rules — first CRIT at high threshold, then WARN at lower
- op: ">="
  value: 90
  severity: CRIT
- op: ">="
  value: 75
  severity: WARN
Rules are evaluated in order, so place the most severe conditions first when using range thresholds.
expand_by_label
Type: string | null — Optional
Used for storage arrays and multi-component devices where a single Prometheus instance exposes metrics for multiple sub-components identified by a label (e.g., disk slot, drive bay, DIMM slot).
When set, the check produces one virtual health state per unique value of the named label in the query results. These virtual states are then aggregated back to a single state for the parent instance.
expand_by_label: slot
This is the generic mechanism that makes per-drive monitoring work for any storage vendor. The slot label value becomes the virtual node identifier:
eseries_drive_status{instance="da01-r01", slot="1", status="failed"}→ virtual nodeda01-r01:slot:1→ CRITeseries_drive_status{instance="da01-r01", slot="5", status="optimal"}→ (absent from main query, getsexpand_absent_state) → OK
expand_discovery_expr
Type: string | null — Optional
A secondary PromQL expression used to discover all possible label values for expand_by_label. This is necessary when healthy components do not appear in the main query (because the main query filters for non-optimal states only).
# Main query: only returns non-optimal drives
expr: eseries_drive_status{status!~"(optimal)",instance=~"$instances"}

# Discovery query: returns ALL drives (optimal + non-optimal)
expand_discovery_expr: eseries_drive_status{instance=~"$instances"}
Slots found in the discovery query but absent from the main query receive expand_absent_state. Slots absent from both queries receive the planner's configured unknown_state.
expand_absent_state
Type: string | null — Optional
The health state to assign to virtual nodes (slots/drives) that appear in expand_discovery_expr but are absent from the main query. Defaults to the planner's unknown_state setting if not set.
Set to "OK" when absence from the main query means healthy. This is the correct value for filter-pattern queries where the main expression only returns non-optimal (problematic) items:
expand_absent_state: OK
# → drives present in discovery but absent from "non-optimal" filter = they are optimal = OK
expand_crit_threshold
Type: integer | null — Optional
Controls how many virtual nodes (slots/drives) must be in CRIT state before the parent instance is promoted to CRIT. When set:
- If CRIT virtual nodes
< expand_crit_threshold→ parent state is WARN (partial failure, degraded) - If CRIT virtual nodes
>= expand_crit_threshold→ parent state is CRIT (serious failure)
This allows modeling RAID or erasure-coded storage degradation semantics:
# Array is WARN with 1 failed drive, CRIT only when 2 or more drives fail
expand_crit_threshold: 2
Without this field, a single CRIT virtual node makes the parent CRIT immediately.
PromQL Placeholder Reference
The Telemetry Planner builds a batched regex from all topology IDs before sending any query. The placeholder is replaced inline:
$instances  →  node01|node02|node03|compute[001-030]|...
$chassis    →  chassis-r01-01|chassis-r01-02|...
$racks      →  r01-01|r01-02|r01-03|...
$jobs       →  12345|12346|12347|...
The result is a single Prometheus query covering all relevant nodes, not one query per node. This is critical for performance: a cluster with 500 nodes still generates only a handful of Prometheus queries per check, not 500.
The max_ids_per_query setting in app.yaml controls batch size (default: 500). If you have more IDs than the limit, the planner splits them into multiple queries automatically.
Built-in Check Libraries
up.yaml — Core Availability
These checks apply to any device with node_up or node_recent_reboot in its template's checks: list.
# up.yaml
checks:
  - id: node_up
    name: Node up
    scope: node
    kind: core
    expr: up{job=~"$jobs",instance=~"$instances"}
    output: bool
    rules:
      - op: "=="
        value: 0
        severity: CRIT

  - id: node_recent_reboot
    name: Node recent reboot
    scope: node
    kind: core
    expr: time() - node_boot_time_seconds{instance=~"$instances"}
    output: numeric
    rules:
      - op: "<"
        value: 600
        severity: WARN
node_up uses the standard Prometheus up metric: 1 when the scrape target is reachable, 0 when it is not. The check on node_recent_reboot computes seconds since the last boot using node_boot_time_seconds from node_exporter. A node that rebooted less than 10 minutes ago is flagged as WARN, alerting operators to unexpected restarts.
ipmi.yaml — IPMI Hardware Sensors
These checks use the prometheus-ipmi-exporter metric conventions. The exporter encodes sensor state as an integer: 0 = OK, 1 = WARN, 2 = CRIT.
# ipmi.yaml
checks:
  - id: ipmi_fan_speed_state
    name: IPMI fan speed state
    scope: node
    kind: ipmi
    expr: ipmi_fan_speed_state{instance=~"$instances"}
    output: numeric
    rules:
      - op: "=="
        value: 1
        severity: WARN
      - op: "=="
        value: 2
        severity: CRIT

  - id: ipmi_power_state
    name: IPMI power state
    scope: node
    kind: ipmi
    expr: ipmi_power_state{instance=~"$instances"}
    output: numeric
    rules:
      - op: "=="
        value: 1
        severity: WARN
      - op: "=="
        value: 2
        severity: CRIT

  - id: ipmi_sensor_state
    name: IPMI sensor state
    scope: node
    kind: ipmi
    expr: ipmi_sensor_state{name!~"Low Security Jmp|Phy Presence Jmp|Dongle Cable",instance=~"$instances"}
    output: numeric
    rules:
      - op: "=="
        value: 1
        severity: WARN
      - op: "=="
        value: 2
        severity: CRIT

  - id: ipmi_temperature_state
    name: IPMI temperature state
    scope: node
    kind: ipmi
    expr: ipmi_temperature_state{instance=~"$instances"}
    output: numeric
    rules:
      - op: "=="
        value: 1
        severity: WARN
      - op: "=="
        value: 2
        severity: CRIT

  - id: ipmi_up
    name: IPMI exporter up
    scope: node
    kind: ipmi
    expr: ipmi_up{instance=~"$instances"}
    output: bool
    rules:
      - op: "=="
        value: 0
        severity: CRIT

  - id: ipmi_voltage_state
    name: IPMI voltage state
    scope: node
    kind: ipmi
    expr: ipmi_voltage_state{instance=~"$instances"}
    output: numeric
    rules:
      - op: "=="
        value: 1
        severity: WARN
      - op: "=="
        value: 2
        severity: CRIT
Note that ipmi_sensor_state uses a label filter to exclude known-benign sensors (Low Security Jmp, Phy Presence Jmp, Dongle Cable). This is the correct pattern for suppressing noise from sensors that always report a non-zero state on specific hardware models — handle it in the PromQL expression, not in the rules.
eseries.yaml — NetApp E-Series Storage
These checks demonstrate the full expand_by_label feature. The storage array exposes one Prometheus instance per controller, but individual drive health is available via labeled time series with a slot label.
# eseries.yaml
checks:
  - id: eseries_exporter_collect_error
    name: E-Series exporter collect error
    scope: node
    kind: eseries
    expr: eseries_exporter_collect_error{instance=~"$instances"}
    output: bool
    rules:
      - op: "=="
        value: 1
        severity: WARN

  - id: eseries_drive_status
    name: E-Series drive health
    scope: node
    kind: eseries
    expr: eseries_drive_status{status!~"(optimal)",instance=~"$instances"}
    output: numeric
    expand_by_label: slot
    expand_discovery_expr: eseries_drive_status{instance=~"$instances"}
    expand_absent_state: OK
    rules:
      - op: "=="
        value: 1
        severity: CRIT

  - id: eseries_battery_status
    name: E-Series battery health
    scope: node
    kind: eseries
    expr: eseries_battery_status{status!~"(optimal|learning)",instance=~"$instances"}
    output: numeric
    rules:
      - op: "=="
        value: 1
        severity: CRIT

  - id: eseries_fan_status
    name: E-Series fan health
    scope: node
    kind: eseries
    expr: eseries_fan_status{status!~"(optimal)",instance=~"$instances"}
    output: numeric
    rules:
      - op: "=="
        value: 1
        severity: WARN

  - id: eseries_power_supply_status
    name: E-Series power supply health
    scope: node
    kind: eseries
    expr: eseries_power_supply_status{status!~"(optimal)",instance=~"$instances"}
    output: numeric
    rules:
      - op: "=="
        value: 1
        severity: CRIT
For eseries_drive_status:
- The main query uses
status!~"(optimal)"to filter — it only returns drives that are not optimal. All returned drives get evaluated: ifvalue == 1, the slot is CRIT. - The discovery query returns all drives regardless of status, so Rackscope knows the full slot population.
- Slots in the discovery result but absent from the main query are optimal →
expand_absent_state: OK. eseries_battery_statusalso excludes thelearningstate, which is a normal transient state for new or replaced batteries.
This design is fully vendor-agnostic in the core: the same expand_by_label mechanism works for any storage system that exposes per-slot/per-drive metrics with a label key.
Virtual Nodes — expand_by_label
For devices that expose per-component metrics (storage arrays with per-disk checks, switches with per-port status), use expand_by_label to monitor each sub-component individually.
checks:
  - id: eseries_drive_status
    name: "E-Series Drive Status"
    kind: storage
    scope: node
    expr: 'eseries_drive_status{instance=~"$instances"}'
    output: numeric
    expand_by_label: "slot"        # ← expand per unique value of this label
    rules:
      - op: "!="
        value: 0
        severity: CRIT
How it works
- The TelemetryPlanner queries Prometheus for all unique values of the specified label (e.g.,
slot=1,slot=2, …slot=60) - A virtual node is created per unique value:
da01-r02-01.1,da01-r02-01.2, … - Each virtual node has its own health state (OK / WARN / CRIT / UNKNOWN)
- Health is propagated independently: a failed drive makes the array CRIT, but other arrays stay OK
Use cases
| Device type | expand_by_label | Virtual node format |
|---|---|---|
| E-Series storage (slot-based) | slot | da01-r02-01.1 |
| DDN storage (drive) | drive | ddn01.5 |
| NetApp (disk) | disk | filer01.3 |
| Network switch (port) | port | sw01.eth0 |
| Chassis (fan, PSU) | fan_id | chassis01.fan1 |
Important
expand_by_labelonly works for checks withscope: node- The label must exist in the Prometheus metric's labels
- If no data is found for a virtual node, it is assigned
UNKNOWN - Virtual nodes appear in the device view alongside physical instances
Template Binding
Checks are activated only for devices whose template references them. A check that exists in the library but is not referenced by any template in the loaded topology will never be queried.
In a device template file, the checks: list contains check IDs:
templates:
  - id: bs-x440-compute-2u-2n
    name: BullSequana X440 Compute (2U 2 Nodes)
    type: server
    u_height: 2
    checks:
      - node_up
      - node_recent_reboot
      - ipmi_up
      - ipmi_fan_speed_state
      - ipmi_power_state
      - ipmi_sensor_state
      - ipmi_temperature_state
      - ipmi_voltage_state
For rack templates:
rack_templates:
  - id: standard-42u-air
    name: Standard 42U Air Cooled
    u_height: 42
    checks: []
This template-scoped design is intentional: it prevents running storage checks on servers, or IPMI checks on PDUs. Only the checks that make sense for a given hardware type are evaluated.
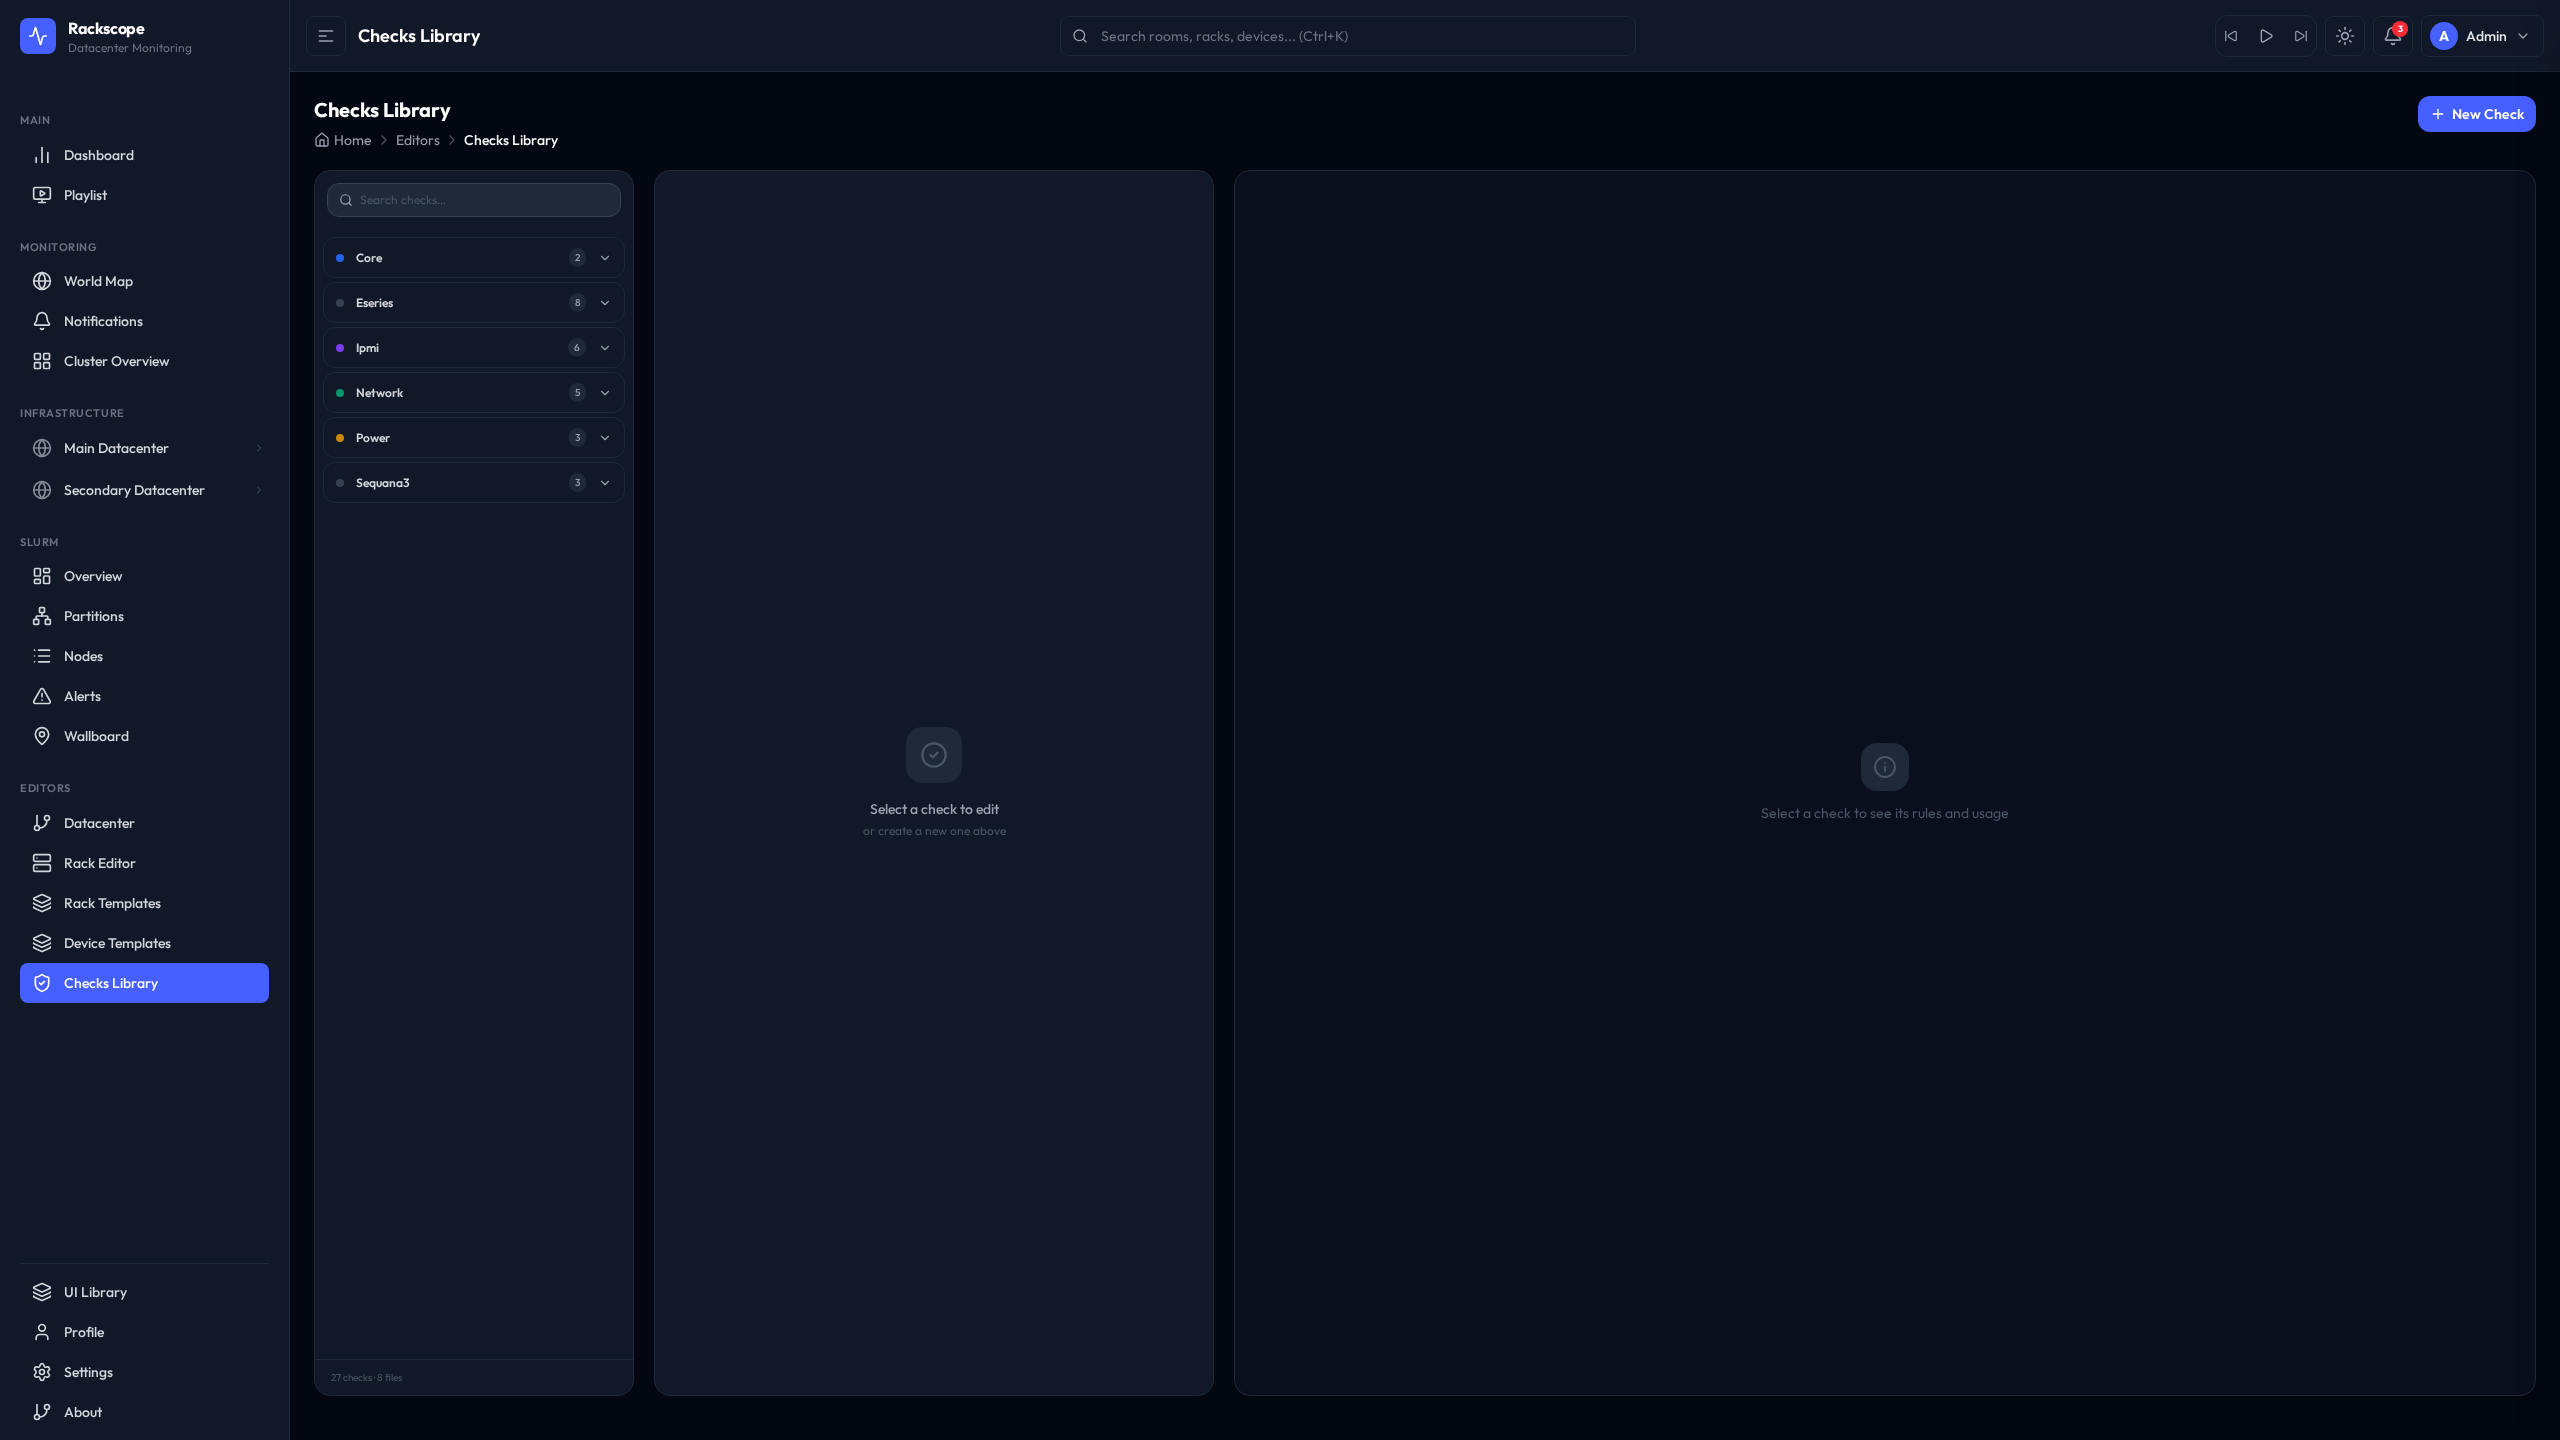
Using the Checks Editor
The Checks Editor provides a visual interface for browsing and modifying check definitions.
URL: /editors/checks
Browsing Checks
The left panel lists all loaded checks grouped by kind. Selecting a check displays its full definition on the right side, including the PromQL expression, rules, and any expand fields.
Editing YAML
The editor uses Monaco (the editor engine from VS Code) with YAML syntax highlighting and inline validation. The YAML structure matches the file format described in this guide.
To modify a check:
- Navigate to
/editors/checks - Select the check from the left panel
- Edit the YAML in the Monaco editor on the right
- Click Save to write changes to disk
- The backend reloads the checks library automatically — no restart needed
Testing PromQL
The Test Query button sends the check's expr to Prometheus with the current topology's instances substituted in. The raw Prometheus response is shown inline, allowing you to verify that the expression returns the expected series and values before saving.
This is useful when writing new checks: paste a raw PromQL expression, test it against live data, then adapt the rules based on observed metric values.
Writing Custom Checks
Example 1: Simple Boolean Check (Node Up/Down)
A check that fires CRIT when a node is unreachable:
checks:
  - id: my_service_up
    name: My service up
    scope: node
    kind: server
    expr: my_service_scrape_up{instance=~"$instances"}
    output: bool
    rules:
      - op: "=="
        value: 0
        severity: CRIT
Save this to config/checks/library/my-service.yaml. Then add my_service_up to the checks: list of the relevant device template.
Example 2: Temperature Threshold Check
A two-level threshold check for a custom temperature metric (values in Celsius):
checks:
  - id: custom_temp_warn
    name: Custom temperature sensor
    scope: node
    kind: server
    expr: custom_temperature_celsius{instance=~"$instances"}
    output: numeric
    rules:
      - op: ">="
        value: 90
        severity: CRIT
      - op: ">="
        value: 75
        severity: WARN
Rules are evaluated in order. A temperature of 92°C matches the first rule (>= 90) and is immediately marked CRIT. A temperature of 78°C does not match the first rule, matches the second rule (>= 75), and is marked WARN. A temperature of 60°C matches neither rule and is OK.
Example 3: Per-Slot Storage Check with expand_by_label
A check for a generic storage array where each disk is identified by a drive_id label:
checks:
  - id: myarray_disk_health
    name: My array disk health
    scope: node
    kind: storage
    # Main query: only returns drives with a failed state
    expr: myarray_disk_state{state!="ok",instance=~"$instances"}
    output: numeric
    expand_by_label: drive_id
    # Discovery query: returns all drives to know the full population
    expand_discovery_expr: myarray_disk_state{instance=~"$instances"}
    # Drives present in discovery but absent from the failure query are healthy
    expand_absent_state: OK
    # Array is CRIT only when 2 or more drives fail simultaneously
    expand_crit_threshold: 2
    rules:
      - op: "!="
        value: 0
        severity: CRIT
This check produces one health state per drive_id label value. If a single drive fails, the array is WARN (because expand_crit_threshold: 2 means fewer than 2 CRITs = WARN). If two or more drives fail, the array becomes CRIT.
Best Practices
Use template scoping to control check execution
Only add a check to a template if it makes sense for that hardware type. Running eseries_drive_status on a compute server produces UNKNOWN states for every node (metric not found), which adds noise. Template scoping ensures clean, relevant health states per device type.
Prefer filter-pattern queries with expand_absent_state
For components where absence means healthy (drives in optimal state, ports that are up), filter the main query to only return problematic items and use expand_discovery_expr + expand_absent_state: OK for the full population. This avoids returning thousands of OK time series on every query cycle.
# Efficient: only non-optimal drives come back from Prometheus
expr: eseries_drive_status{status!~"(optimal)",instance=~"$instances"}
expand_absent_state: OK
Suppress known-benign sensors in the expression
Handle noisy sensors via PromQL label filters rather than adding exceptions in code:
# Filter out specific sensor names that always report non-zero on your hardware
expr: ipmi_sensor_state{name!~"Low Security Jmp|Phy Presence Jmp",instance=~"$instances"}
Keep the max_ids_per_query setting appropriate for your Prometheus
The default of 500 IDs per query batch is conservative. Larger clusters with fast Prometheus instances can increase this value in app.yaml under planner.max_ids_per_query to reduce the number of Prometheus API calls per refresh cycle.
Use the planner.cache_ttl_seconds setting to tune freshness vs. load
The Telemetry Planner caches check results for planner.cache_ttl_seconds seconds (default: 60). Lowering this value gives fresher data at the cost of more Prometheus queries. For production NOC environments, 60 seconds is usually appropriate. For demos or smaller labs, 10–30 seconds provides a more responsive experience.
Organize checks in separate files per hardware family
Avoid putting all checks in a single file. The folder-based library makes it easy to add, disable, or replace an entire hardware family's checks by adding or removing a single file. Follow the convention of one file per exporter or hardware vendor.