About Rackscope
Rackscope is an open-source, Prometheus-first physical infrastructure monitoring dashboard built for data centers and HPC environments.
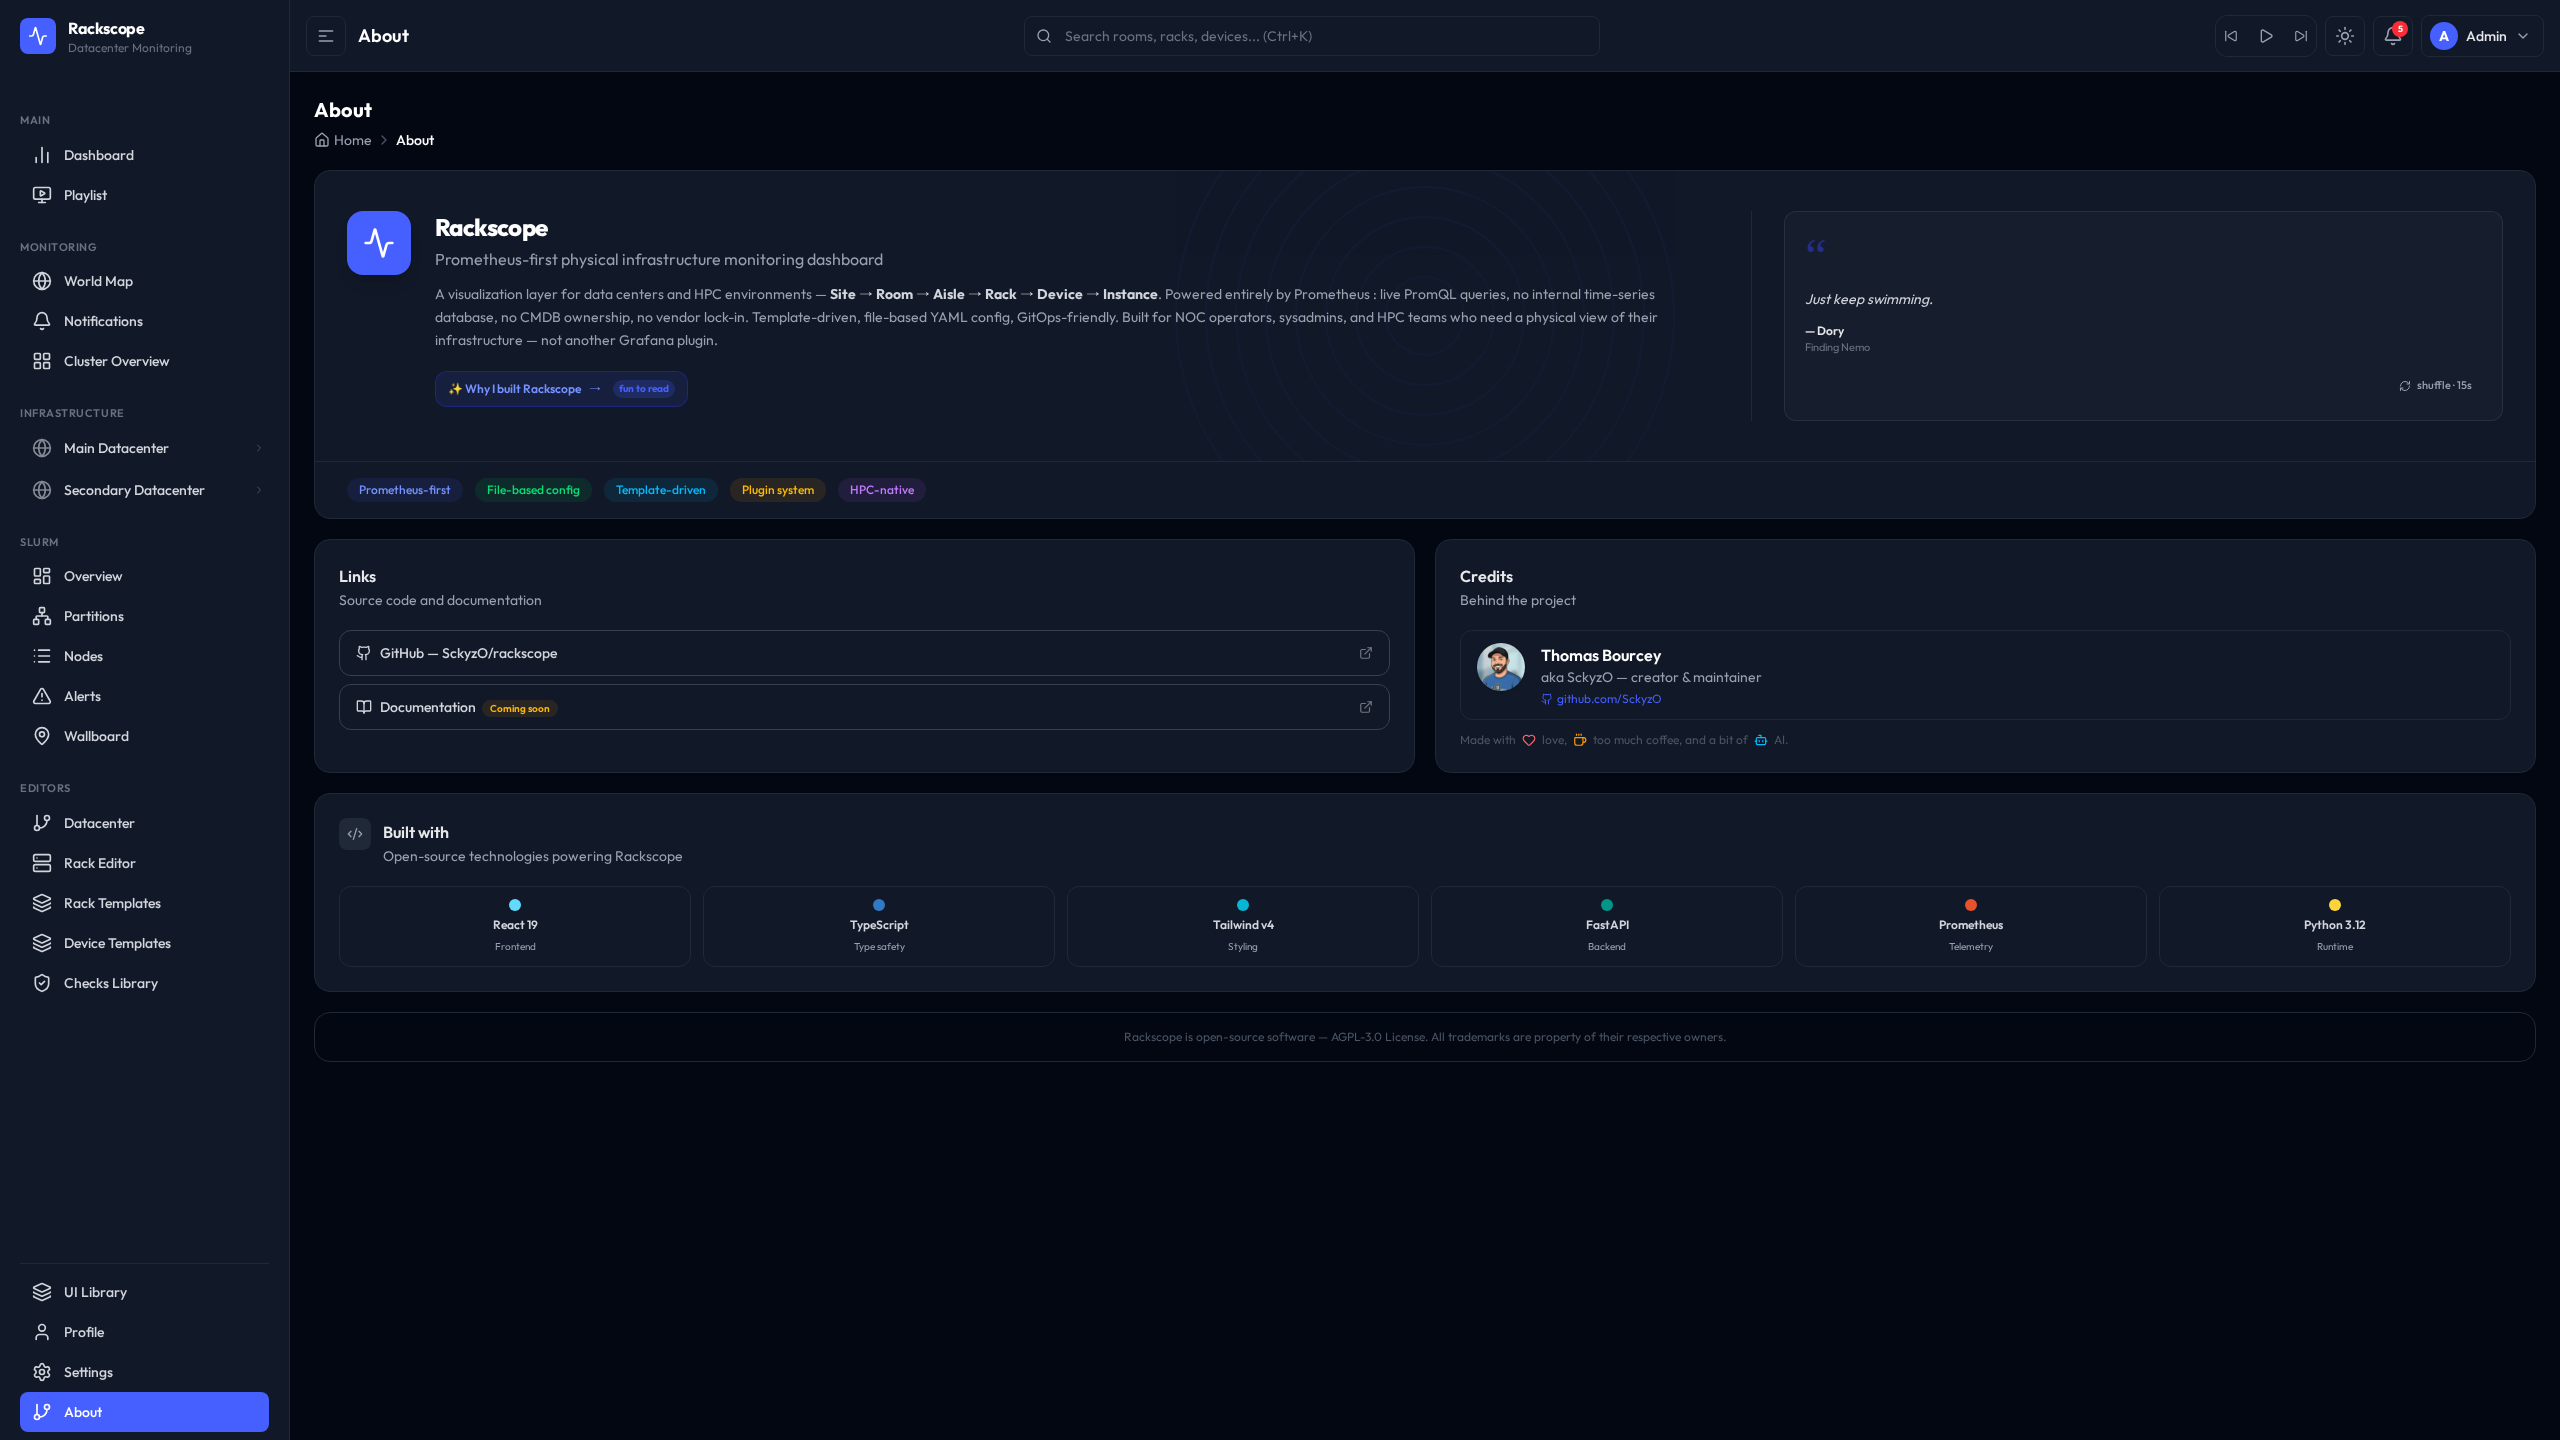
Mission
"See your infrastructure, not your spreadsheets."
Physical infrastructure monitoring has a dirty secret: most monitoring stacks are excellent at telling you what is broken but terrible at telling you where it lives. A node goes CRIT and you are left hunting through a CMDB, a rack diagram in a PDF somewhere, or — if you are unlucky — a spreadsheet last updated in 2019.
Rackscope was built to close that gap.
It is designed specifically for NOC operators, N1/N2 sysadmins, and HPC teams who spend their shifts staring at cluster dashboards and need to know — instantly — which cabinet, which aisle, which room, which site. Not a metric ID. Not a hostname. A physical location.
Rackscope does not replace your existing tooling. It does not compete with Prometheus, Alertmanager, or Grafana. It adds the one thing they are missing: a physical-layer view that maps your real-world infrastructure to the metrics already flowing through your stack.
Philosophy
Rackscope is built on three principles that are non-negotiable:
1. Zero Database
Configuration lives in YAML files. That is it.
No PostgreSQL to provision, no migrations to run, no schema to evolve. Your topology, your
templates, your health check rules — all plain text, all in config/. Commit them to Git,
diff them in pull requests, roll them back with git revert.
This is not a limitation. It is a design choice that makes Rackscope trivial to operate, trivial to back up, and trivial to hand off to the next person on your team.
External CMDBs (NetBox, RacksDB, BlueBanquise) are supported as importers — they feed Rackscope's YAML files, not the other way around.
2. Prometheus-Only Telemetry
Rackscope does not collect a single metric. It does not run agents. It does not poll SNMP, Redfish, or IPMI directly.
Every health state you see — every OK, WARN, CRIT — comes from a live PromQL query against your existing Prometheus instance. If your exporters already push data to Prometheus, Rackscope can visualize it with zero additional telemetry infrastructure.
This keeps the blast radius small. A Rackscope outage does not affect your monitoring. Your monitoring is Prometheus — Rackscope is a consumer, not a dependency.
3. Physical Hierarchy First
Rackscope thinks in racks, not dashboards.
The data model is Site → Room → Aisle → Rack → Device → Instance. Every view, every health
state, every alert is anchored to a physical location. Health states aggregate upward:
a failing node makes its device CRIT, which makes its rack CRIT, which makes its room CRIT.
This is not Grafana with a floor plan plugin bolted on. The physical hierarchy is the core data model, not an afterthought.
Tech Stack
| Layer | Technology |
|---|---|
| Frontend | React 19, TypeScript, Tailwind CSS v4, React Router |
| Icons | Lucide React |
| Maps | Leaflet (world map and room floor plans) |
| Charts | ApexCharts |
| Code editor | Monaco Editor (YAML editing) |
| Backend | FastAPI, Python 3.12, Uvicorn |
| Data validation | Pydantic v2 |
| HTTP client | httpx (async Prometheus client) |
| Configuration | PyYAML |
| Telemetry | Prometheus (PromQL, no write path) |
| Containerization | Docker, Docker Compose |
Easter Eggs
Rackscope has a few hidden surprises for curious operators. Some have been documented. Others are waiting to be found.
Confirmed sightings:
-
Type
helpanywhere on the page — a retro boot terminal overlay appears. It boots. Slowly. On purpose. The sysadmins who found it have not complained. -
The Matrix dark theme — activate it from the theme picker. There is no spoon. (Also, the sidebar changes. You did not hear that from us.)
-
The Konami Code — it does something. Somewhere in the app. Up up down down left right left right B A. Classic for a reason.
-
The About page itself — you are already here. Try clicking things that do not look clickable. Try typing things. The page knows you are reading this.
-
More waiting to be discovered — Rackscope is a tool built by people who spend too much time in data centers at 3 AM. Expect accordingly.
Easter eggs are non-destructive and do not affect configuration or metrics. They are strictly for the operators who deserve a moment of whimsy in a windowless room.
Contributing
Rackscope is open source and welcomes contributions.
Repository: github.com/rackscope/rackscope
How to contribute:
- Read
CONTRIBUTING.mdin the repository root for the full workflow - Check open issues for
good first issuelabels - Fork, branch, implement, test, submit a pull request
- All changes go through
make lintandmake test— CI will enforce this
Key conventions:
- English only for code, comments, and commit messages
- Conventional commits (
feat:,fix:,refactor:, etc.) - Small, focused PRs — one intent per commit
- The core system must remain vendor-agnostic: no hardcoded vendor logic in Python or TypeScript
License: AGPL-3.0. Use it, self-host it, contribute back. For commercial or SaaS deployments, contact the maintainers for a commercial license.
Credits
Rackscope is built on the shoulders of excellent open-source projects:
- TailAdmin — admin dashboard UI components and design patterns
- Prometheus ecosystem — Prometheus, node_exporter, IPMI exporter, and the broader community of exporters that make telemetry-first infrastructure possible
- FastAPI — the framework that makes writing clean Python APIs genuinely enjoyable
- React and the broader JavaScript open-source community
- Every operator who filed a bug, asked a question, or sent a PR
Special thanks to the HPC teams and datacenter operators who provided feedback during early development. You know who you are.
Rackscope is not affiliated with any vendor. All product names mentioned are trademarks of their respective owners.